
The need and opportunities to accelerate the reduction in agricultural greenhouse gas (GHG) emissions have been underlined in a number of recent reports (see, for example, the IPCC Special Report on Climate Change and Land (2018) or the IEEP report Net-Zero Agriculture in 2050: How to Get There (2019)). Following a period from 1990 to 2012 with a steady decrease in EU agricultural emissions amounting to 22% in total, these emissions have begun to increase since then, growing by 4% over the 2012-2017 period.
In this post, I examine the projected trend in agricultural emissions to 2030, drawing on the most recent European Environment Agency (EEA) report on Trends and Projections in Europe 2019 as well as the inventory of policies and measures that Member States have taken or plan to take to reduce these emissions in future. These policies and measures are discussed in the Eionet report Overview of reported national policies and measures on climate change mitigation in Europe in 2019 and collected in the EEA database on climate change policies and measures in Europe (both accessible from the EEA webpage on Policies and Measures).
The projections indicate that Member States do not expect to make further significant reductions in agricultural emissions by 2030. Even with additional measures planned but not yet implemented in 2019, agricultural emissions are expected to fall by less than 5% between 2017 and 2030. Overall emissions are projected to fall by 18% but the EEA assesses that this will not be sufficient to meet the existing 2030 target of a 40% reduction in emissions compared to 1990.
If, in addition, the climate ambition of the European Green Deal is to be realised, further efforts to reduce emissions in the non-agricultural sectors but also in agriculture will be required. However, to properly incentivise, motivate and track progress in the farming sector, I argue that a focus on agricultural emissions alone is misleading and should be supplemented by also considering changes in land use emissions and removals that are under the control of farmers. This will require changes in the way that the EEA presents its inventories as well as rethinking the relationship between emissions in the effort sharing sectors and emissions and removals in the land sector in EU climate policy.
Trends and projections of agricultural emissions
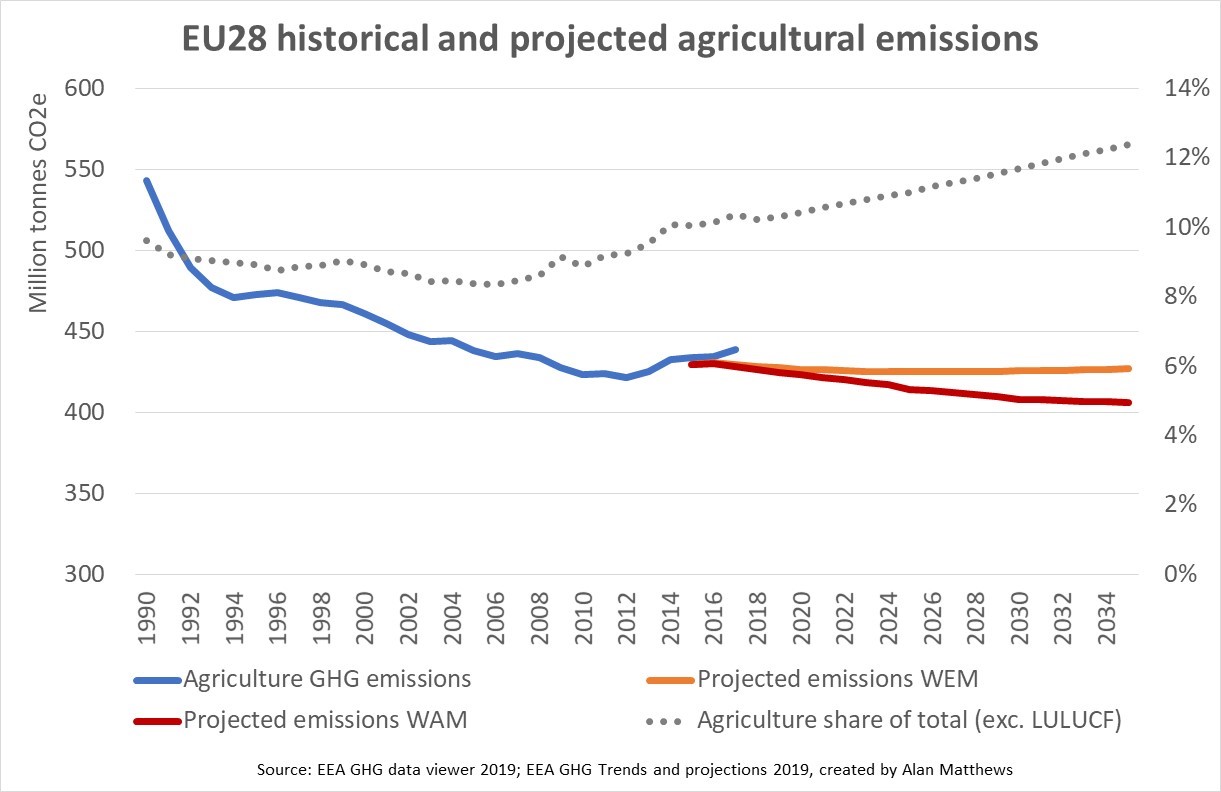
The chart below shows the historical trend in agricultural emissions as reported in the EEA annual inventories as well as projections to 2035 as estimated by the EEA based on Member State projections. The figures are for the EU28 meaning the EU27 Member States plus the United Kingdom. They are based on converting all greenhouse gases (GHGs) to CO2 equivalents (CO2e) using equivalence weights based on global warming potential (GWP) values reported in the IPCC’s Fourth Assessment Report (AR4).
Agricultural emissions in the inventory consist almost entirely of the non-CO2 gases of methane CH4 and nitrous oxide N2O (with very minor amounts of CO2 emissions associated with liming, urea and the use of other carbon-containing fertilisers). These emissions are associated with livestock production (both enteric fermentation and manure management) and the application of fertilisers to agricultural soils (which stimulates the production of nitrous oxide as a by-product of microbial transformations of nitrogen in the soil).
The figures do not take account of carbon sequestration or emissions from agricultural land as these are reported in the IPCC sector Land Use, Land Use Change and Forestry (LULUCF). Changes of CO2 in agricultural soils due to cultivation particularly of organic soils or the incorporation of crop residues in soils are not attributed to agriculture in the EEA inventories This is also the case where carbon is sequestered in hedges, trees or through rewetting of drained organic soils.
Trends in agricultural emissions are driven primarily by changes in activity data (mainly changes in ruminant livestock numbers (cattle and sheep) and in the volume of organic and chemical nitrogen fertiliser applied. Other factors that play a role over time include changes in livestock feeding regimes, in the management of manure, in rice cultivation as well as changes in emission factors due to technical and productivity improvements in agricultural production.
The graph above shows that there was a particularly sharp fall in agricultural emissions between 1990 and 1993 (of around 12%). It then took twenty years for a further fall of 12% in emissions (from the 1993 base, 10% from the 1990 base) before emissions started increasing again. The sharp reduction between 1990 and 1993 most likely reflects the disruptions caused to agricultural production in the newer EU Member States following the fall of the Berlin Wall in 1989 and the complex transition to a market economy in these countries. It may also be associated with the introduction of the Nitrates Directive in 1991 as cattle numbers fell by 11% and inorganic N use by 14% over that short period.
The fall in agricultural emissions mirrored the fall in EU total emissions over the period (in 2017, total emissions were 22% below 1990 levels). This is shown in the dotted line in the chart above which plots the share of agricultural emissions in the total. This shows a general stability at just under 9% of total emissions over the period 1990-2013, though this had risen to over 10% by 2017.
The chart also shows projections of agricultural emissions under two scenarios – WEM With Existing Measures, and WAM With Additional Measures. The WEM scenario is based on policies and measures existing and adopted when the projections were submitted by Member States in March 2019 under the 2013 mechanism for monitoring and reporting emissions Regulation (EU) No 525/2013 (MMR). The WAM scenario includes in addition policies that were at the planning stage when the projections were submitted.
In the EEA spreadsheet that reports the projections data the various series start at 2015 so there are three years that overlap with the inventory data. Historical emissions in the overlapping years have grown more rapidly than foreseen in the data used in the Member State projections, suggesting that the projections are likely to underestimate the trends in emissions in the two scenarios. These scenarios do not take account of any changes in economic activity expected as a result of the measures taken to prevent the spread of the coronavirus in the first half of 2020.
The projections show that Member States expect a relatively modest reduction in agricultural emissions up to 2030. With additional measures, a further reduction of around 20 Mt CO2e is projected compared to 2017 emissions of 429 Mt CO2e, or a reduction of slightly less than 5%. Economy-wide emissions are expected to fall by 18% over this period, resulting in a rise in the share of agricultural emissions to closer to 12% by 2030.
Are planned measures sufficient to reach existing 2030 targets?
The EU as a whole is currently committed to reducing its emissions by 40% compared to 1990 by 2030. EU climate policy has three legs each with separate targets: the Emissions Trading Scheme (ETS) for the power sector, large industrial plants and aviation inside the European Economic Area; effort-sharing in the non-ETS sector which includes transport, buildings, agriculture and waste; and a ‘no debit’ rule in the land use, land use change and forestry (LULUCF) sector meaning that emissions cannot exceed removals. If this sector creates net emissions, these need to be compensated by using allowances from the effort sharing sectors.
As the cap-and-trade system under the Emissions Trading Scheme guarantees that 2030 targets will be met (even though the most recent projections suggest that existing and additional measures are still not sufficient to meet the target), the main uncertainty in reaching the overall EU target is progress in the non-ETS sector. Member States have individual national targets under the 2018 Effort Sharing Regulation. Together, these are intended to achieve a 30% reduction in non-ETS emissions by 2030 compared to the 2005 base year.
There are two parallel reporting procedures that allow us to track whether Member State initiatives are likely to be sufficient to meet this target. In addition to the projections submitted biannually since 2015 under the MMR previously mentioned and which are collated and published by the EEA, Member States are also developing their National Energy and Climate Plans (NECPs). These are mandated under the Governance of the Energy Union and Climate Action Regulation (EU) 2018/1999. They represent the framework within which Member States have to plan, in an integrated manner, their climate and energy objectives, targets, policies and measures.
NECP projections
Each NECP contains a list of planned measures and stated ambitions for national GHG emissions reductions. Countries must develop their NECPs on a rolling basis, with an update half-way through the implementation period. NECPs for the first period 2021 to 2030 should ensure that the Union’s 2030 targets for GHG emissions reductions, renewable energy, energy efficiency and electricity interconnection are met.
The plans are developed on an iterative basis between the Commission and the Member States. Member States first submit a draft NECP. The Commission reviews the draft plans and can issue recommendations for increased ambition to Member States if it assesses that they are not doing enough. For the share of energy from renewable sources and for energy efficiency, where there are EU-wide targets but no specific national targets, a set of objective criteria are set out in Annexes to the Governance Regulation on which the Commission can make its assessment. For GHG emissions reduction targets, the relevant benchmarks are the effort-sharing targets for each Member State.
Member States are expected to take these recommendations into account when submitting their final plans. The Commission can also make recommendations if at any point in time a Member State is falling off track in delivering its targets asking them to take additional measures to bring them back in line.
Member States were required to submit their first draft NECP by 31 December 2018. The Commission returned these drafts with its recommendations in June 2019. The Commission assessed that the overall GHG reduction for the Union as a result of these plans would be in line with the -40% emissions reduction target for 2030 compared to 1990.
For the effort sharing sectors, it concluded that the planned measures in the draft NECPs showed that the EU could achieve a 28% reduction in emissions in non-ETS sectors. It thus sought additional measures to fill the remaining 2 percentage point gap in the final NECPs. Although the final NECPs were due to be delivered by 31 December 2019, the Commission’s NECP web page shows that, as of 18 March 2020, many major players such as Germany, France and Spain had yet to do so.
In making its assessment, the Commission relied on Member States’ own projections of the emissions reductions associated with additional measures (where this information was provided) or else the emissions reductions associated with implementing existing measures. The Commission assessment does not assess whether the measures outlined in the NECPs are capable of delivering the reductions that Member States have pencilled in to their projections.
In principle, such Quality Check/Quality Assurance should be carried out at an earlier stage. It is clear that, despite the detailed guidance available from the EEA, most Member States are struggling to provide the relevant information. This becomes clearer when the information on agricultural mitigation strategies is examined later.
EEA MMR projections
Based on the MMR projections submitted in March 2019, the EEA concludes that accounting for planned additional measures the EU27 and UK together expect to reach emission reductions totalling 36% by 2030 (compared with 1990 levels). The EEA explains that the differences with the NECP projections are due to differences in the additional measures assumed as well as differences in the way missing data are interpolated.
The EEA estimates that for the EU27 and UK together effort sharing emissions could decrease to a level 27% below that of 2005 by 2030 with additional measures. Similar to the Commission’s finding based on the draft NECPs, it concludes that a more focused effort will be necessary to reach the existing 30% reduction target.
In a further briefing on these trends earlier this month which is based on updated emissions trends to 2018, the EEA noted that non-ETS emissions had fallen by 11% between 2005 and 2018 and indeed were below the corresponding target level for the period 2013-2020. However, the pace of reduction must dramatically increase in order to reach the 2030 target, as shown in the following chart.
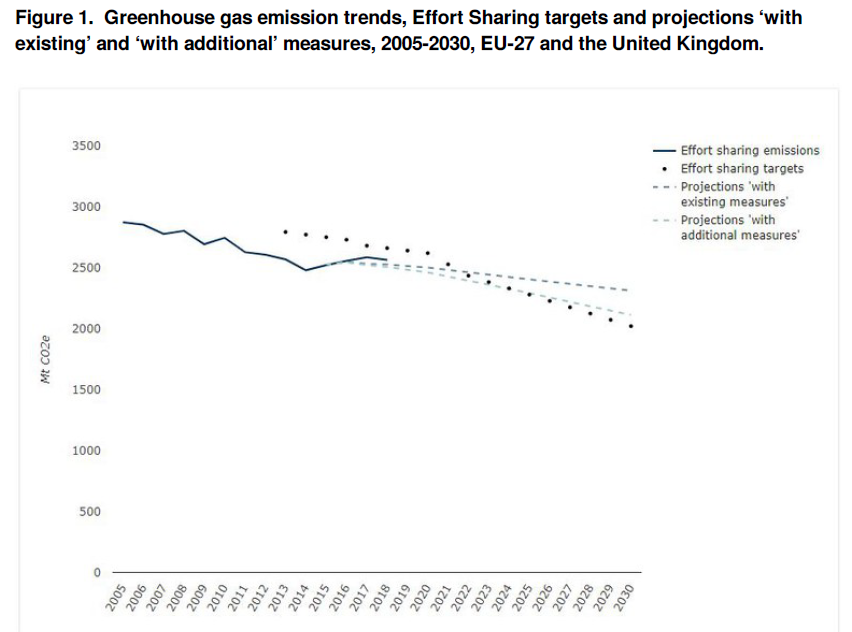
“Today – more than halfway through the 2005-2030 period – the total reduction achieved so far in the Effort Sharing sectors represents only one third of the reduction needed by 2030 to achieve the target of a 30% reduction compared with 2005 in these sectors. From 2018 onwards, the annual rate of emission reductions at EU level needs to nearly double to achieve the cuts foreseen under the Effort Sharing Regulation”, according to the EEA.
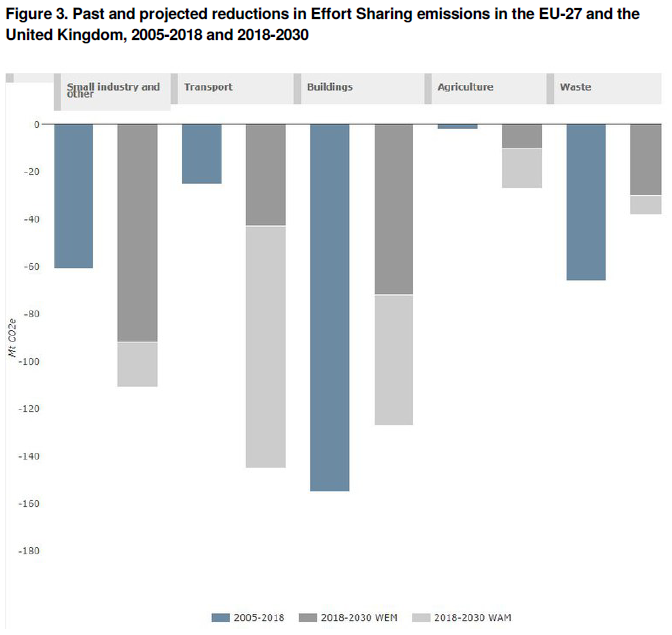
During the 2005-2018 period agriculture contributed just 1% of the emissions reduction, a mere 2 Mt CO2e of the 309 Mt CO2e reduction. Most of the projected reductions in the coming period up to 2030 are also expected in the transport, buildings and industry sectors. As the following chart illustrates, agriculture remains the sector where countries foresee only minimal change in emissions over the next decade. In the next section, the measures taken and planned by Member States are analysed further.
Agricultural mitigation policies and measures
As part of the biannual MMR reporting, Member States are asked to report on the existing and additional policies and measures they are taking within each sector using a standard template. The EEA has created a database of the reported policies and measures based on the 2019 submissions. This allows an overview of what Member States are doing or planning to do to reduce agricultural emissions although the current standard of reporting leaves a lot to be desired as discussed later.
Gaps in reported measures
The EEA’s own status update states that the number of reported agricultural policies and measures showed a relatively larger increase between 2017 and 2019 compared to other sectors. According to its analysis, Member States in 2019 reported 212 policies and measures having effects on agricultural GHG emissions. Most (72%) were implemented in response to the EU’s Common Agricultural Policy. The most reported objectives are reduction of fertiliser/manure use on cropland (38% of all agricultural policies and measures) and improved animal waste management systems (30% of all agricultural policies and measures). However, in my extraction of the reported agriculture measures in this spreadsheet I could only identify 148 measures. The spreadsheet also includes the brief description of each measure provided by the Member State as well as the specific agricultural objective or objectives it addresses.
Of these 212 measures identified by the EEA in 2019, 55 are planned policies or measures by 12 Member States targeting additional GHG reductions from agriculture. These measures most commonly aim at improving cropland management (19 measures), reducing fertiliser use and manure application on cropland (15 measures), and improving livestock management (10 measures). Policies and measures reported are often related to the implementation of European policies such as the Common Agricultural Policy, the Nitrates Directive and the Renewable Energy Directive.
However, this catalogue of measures should come with a strong health warning, even apart from the apparent discrepancy in the total number of agriculture policies and measures just noted. This is partly because countries report policies and measures at different levels of aggregation. For example, Austria reports just one measure “This measure summarises the implementation of the programme for rural development 2014-2020 and the implementation of the Common agricultural policy (CAP). Herein measures such as improved feeding of pigs and poultry, covering of manure storage, low-loss application of manure and biogas slurry, promotion of organic farming, reduced usage of mineral fertiliser and promotion of grazing are summarised”. Other countries would report each of these as separate individual measures.
More disconcerting is that there are clear gaps in what Member States report. For example, all Member States have put in place support for organic farming. Some countries report this as a GHG mitigation measure, many don’t. Ireland lists just one agricultural mitigation measure – the use of nitrification and urease inhibitors in conjunction with nitrogen fertilizers under its agri-environment-climate scheme GLAS. But its National Mitigation Plan published in 2017 and which was the relevant planning document in March 2019 when the MMR report was submitted lists many more initiatives in its agricultural chapter. I suspect there are similar gaps for other countries.
Absence of quantification of measures
The way in which policies and measures are reported would be less significant if they were associated with clear quantitative targets. Ideally, one would like to see a specified reduction target for a sector consistent with a Member State’s overall targets, and then a series of individual policy measures with associated emissions reductions which, when summed together, would add up to the reduction target. The MMR reporting template encourages Member States to provide this information, but very few do. According to the EEA, only 18% of single measures affecting the agricultural sector have at least one quantitative estimate on expected emission savings. And the information that is provided does not seem very reliable, despite the QC/QA process it undertakes.
For example, take that Irish planned measure (listed as planned in early 2019 but also listed as implemented in 2018) to encourage the use of nitrification and urease inhibitors. Ireland reports that this measure will lead to a reduction in CO2e emissions of 187,240 tonnes in 2020, 187,340 tonnes in 2025 and 187,470 tonnes in 2030. The adoption curve of this innovation by farmers implicit in these figures does not seem credible. But Ireland at least has attempted some quantification and remains very much the exception.
The technical difficulties in estimating the impact of specific mitigation measures should not be underestimated. However, without information on the expected emissions reductions that can be achieved with different measures, and an estimate of the cost of each measure, it will not be possible for Member States to prioritise and choose between different measures nor to undertake meaningful policy evaluation.
Many Member States will have available Marginal Abatement Cost Curves (MACCs) showing various possible interventions and their abatement potential at different economic prices which could be used as the basis for developing these policy impacts. There is a very helpful review of the lessons learned in the development of agricultural MACCs in various EU countries in this 2018 paper by Eory et al in the Journal of Cleaner Production (open access version here). We are clearly a long way from this desirable state in agricultural mitigation policy.
Additional measures in the Farm to Fork Strategy
The Commission’s proposal for a Farm to Fork Strategy as part of the European Green Deal (now delayed at least to the end of April by the measures taken to control the spread of the coronavirus) will have some implications for future agricultural emissions mitigation potential but how important it will be remains to be seen. Some clues are available from the latest (13 March 2020) draft of the Strategy published by politico.eu under preparation in the Commission but it is important to remember that this is still a document under development and further changes can be expected.
Specifically, as far as food production is concerned, the Strategy is expected to increase the level of ambition to reduce significantly the use and risk of chemical pesticides, as well as the use of fertilisers and antibiotics. It is also expected to push for an expansion in the area under organic agriculture. To promote efforts to encourage carbon sequestration, it is likely to propose an “EU carbon farming manual” to quantify emission reductions and carbon removals in farms and forestry system as the basis for payments (e.g. under CAP support) and for labelling.
Additional initiatives will be proposed on the food consumption side, including measures to reduce the environmental impact of the food processing and retail sectors, reducing food waste and labelling to nudge consumers into making more sustainable food choices. Environmental NGOs are pressing for the inclusion of further initiatives to reduce meat consumption and production.
A number of these measures would indeed help to reduce agricultural emissions. Reduced nitrogen fertiliser use would help to limit N2O emissions and, depending on how it was implemented, along with an increased area under organic farming, could have an indirect effect on ruminant livestock numbers. Improving the robustness of carbon accounting on farms could open the way for additional market-based incentive policies whether financed by the CAP or by the private sector.
Successful implementation will require these targets and measures to be fully integrated into national CAP Strategic Plans. It is reported that the Strategy will encourage Member States to set ambitious targets and to put in place reporting arrangements on the delivery of the objectives of the Strategy. For this to happen, the Strategy will need to strengthen the governance arrangements for the preparation and approval of national CAP Strategic Plans.
Conclusions
The minimal reduction in EU agricultural emissions that has taken place in recent years (if measured with 2005 as the starting date) and the limited reduction foreseen in Member State projections raise many questions. It is generally acknowledged that agricultural emissions cannot be reduced to zero, but what would be an appropriate target? What is the scope for reducing emissions by adopting different agricultural practices or techniques or can emissions only be reduced by reducing activity levels? If activity levels are reduced in Europe, what is the impact on global emissions?
Agricultural emissions are predominantly non-CO2 gases. Does the current metric of aggregating different gases to CO2 equivalents using the Global Warming Potential (GWP100) accurately reflect the impact of agricultural emissions on global temperature, given the different characteristics of short-lived gases such as methane and long-lived gases such as CO2 and N2O in the atmosphere? The answer to this question will influence the priority given to reducing emissions from ruminant livestock.
The biannual review of the policies and measures reported by Member States to reduce agricultural emissions under the MMR remains deeply problematic, even if the 2019 review was the third time the exercise was undertaken. The data reported are incomplete, both with regards to the coverage of measures and their quantification. Where data are reported, they are not always accurate or reliable. As emissions reduction targets become more stringent, it is in the interests of Member States themselves to improve the quality of this reporting. The information sought is the necessary basis for designing the most cost-effective pathways for emissions reductions when establishing the climate action elements in CAP Strategic Plans.
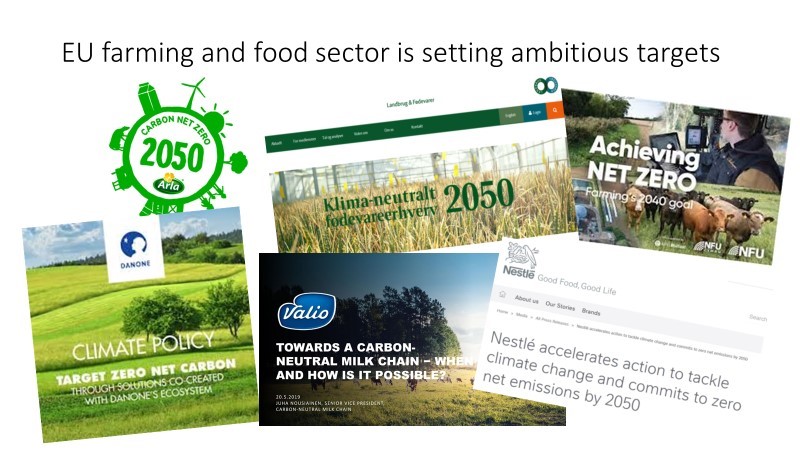
Despite the limited reduction projected for agricultural emissions up to 2030, a number of national farm organisations (for example, in Denmark and the UK) as well as various food firms (notably concentrated in the dairy sector, see chart below) have announced their intention to have net-zero emissions by or before 2050. Given that agricultural emissions cannot be reduced to zero, these commitments assume that agricultural emissions will be offset by carbon sequestration in sinks or displacement of fossil fuel emissions in other sectors.
Official EU policy is only partly supportive of these initiatives. The idea of offsetting carbon dioxide emissions by land-based removals remains controversial although it is fully congruent with the Paris Agreement. This sets out the objective of “a balance between anthropogenic emissions by sources and removals by sinks of greenhouse gases in the second half of this century” in order to achieve the long-term temperature goal of holding the increase in the global average temperature to well below 2°C above pre-industrial levels and pursuing efforts to limit the temperature increase to 1.5°C above pre-industrial levels.
Suspicion that carbon sequestered in natural sinks is highly uncertain, difficult to measure, may not be permanent and can be used to justify less ambitious targets to reduce fossil fuel emissions influenced the design of the 2030 Climate and Energy Framework. Fungibility between net sink removals in the LULUCF sector and emissions in the effort-sharing sector (including agriculture) is severely limited for these reasons (the linkages between the two policy regimes are explained in my blog post here). The various arguments are reflected in the responses to the Commission’s 2015 public consultation on addressing greenhouse gas emissions from agriculture and LULUCF in the context of the 2030 EU climate and energy framework and in the subsequent impact assessment.
While a refusal to allow fossil fuel emissions to be offset by LULUCF credits can be justified, this is not the case for agricultural emissions which, as we have seen, cannot be reduced to zero. Furthermore, for a farmer making decisions on how best to manage his or her land, a sharp distinction between agricultural emissions and land-based removals does not make sense. These activities are so closely linked together that the appropriate signal to farmers should be a combined target.
This is recognised in the way the Scottish government presents its emissions inventory, which reports net emissions from ‘agriculture and related land use’. In addition to emissions from livestock and agricultural soils, this includes net emissions from cropland, grassland along with net emissions from land converted to cropland and grassland. It also includes energy emissions from stationary combustion sources and off-road machinery.
In the Scottish approach, forestry removals are reported separately in a forestry sector that is kept separate from agriculture and related land use. It includes changes in net emissions resulting from afforestation, deforestation and harvested wood products. The basis for Scotland’s approach is discussed in this paper ‘The true extent of agriculture’s contribution to national greenhouse gas emissions’ by Bell et al, 2014.
My key conclusion is that it does not make sense to evaluate the efforts made by the farming sector to tackle climate change by looking solely at the trend in agricultural emissions without taking into account at the same time its contribution to carbon removals (as in Scotland and Ireland, when reporting agricultural emissions, on-farm energy use should also be included). While LULUCF emissions and removals are fully integrated into the EU’s climate policy from next year, the signals and incentives given to farmers are not coherent.
The EEA must continue to report EU emissions inventories and trends and projections to the UNFCCC in the format prescribed. However, for the purpose of tracking progress within the EU it should prepare a supplemental set of accounts along the lines of the Scottish approach that integrate agriculture and related land use. In countries where woodlands and new tree planting takes place on agricultural land, consideration might be given to including this under the ‘agriculture and related land use’ heading rather than forestry. This would both facilitate more credible target-setting for the agriculture sector as well as describe more accurately the efforts being made by the farming sector to address climate change. Focussing solely on agricultural emissions is simply misleading and will demotivate farmers who are also required to help in stabilising the climate.
At the same time, in the context of the greater climate ambition set out in the European Green Deal and the Farm to Fork Strategy and more stringent 2030 targets, there is a need to re-open the 2018 agreement on the treatment of LULUCF emissions and removals. There may be a case to discount LULUCF removals to take into account their lack of permanence and the uncertainty of measurement. However, once that decision is made, there should be no artificial limit on the amount of removals from ‘related land use’ that can be transferred to the effort-sharing sectors where they should be reported combined with agricultural emissions as recommended above.
This post was written by Alan Matthews
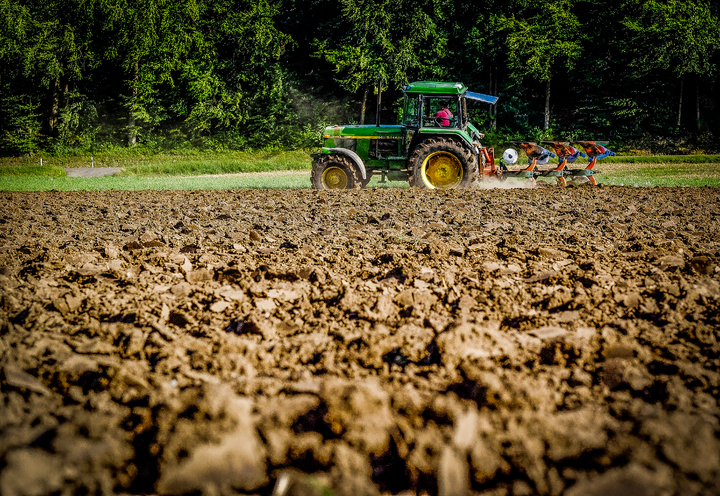
Picture credit: PxHere CC Public Domain
Update 22 October 2020: The disruption caused by the transition to market economies in the newer EU Member States has been added as a possible cause of the sharp fall in emissions between 1990 and 1993.

Thanks for a sobering look at the difficulties for net farm emission measurements, including through sequestration rewards.
As an international trade lawyer without knowledge of food production, I can only look with dismay at the lack of progress in COP 21-25, in the Koronivia process, and in the “forgotten” FAO as the ideal forum for developing such measurements. We all agree that what matters for global warming is only the impact of mitigation measures at the global level. Hence, your article has the key question here: “If activity levels are reduced in Europe, what is the impact on global emissions?”
From there, and turning to trade rules, it seems to me the first priority – before shooting ruminants – would be to agree on a yardstick for the different emissions from agriculture and LULUCF. The first benefit would be a possibility to compare national efforts under the Paris Agreement mechanisms (COP). Secondly, the climate impact of products, and of mitigation policies, could then emerge along a line ranging from “successful mitigation” to “climate dumping”, with “good agricultural climate practices” in a “neutral” center. Thirdly – and most importantly in a WTO assessment – this yardstick would indicate cases with a dumping effect distorting trade, so much so as to allow antidumping measures by importing countries whose producers apply good practices. At the same time, developing countries could benefit from a “special and differentiated treatment”, as mandated by Paris. And support to good agricultural climate practices could be classified in the Green Box even if it “minimally” distorts prices.
A long road ahead? Indeed. Not a single country has made a binding commitment in its revised NDC under the Climate Agreement. However, without agreed international standards, the presently available multilateral trade rules can hardly be made to apply to climate dumping.
Let’s go for international standards! No time to waste!
@Thx, Christian, for raising this WTO angle.
For those interested in following Christian’s views on the interaction between WTO rules and climate policies in agriculture a good place to start is this blog post https://worldtradelaw.typepad.com/ielpblog/2019/04/guest-post-might-wto-law-prevent-climate-change-mitigation-affecting-agricultural-trade.html and the linked FAO reference.
Hi Alan, in order to motivate and inspire farmers to be more sustainable, are there any tools that, in addition to collecting data, also process this and provides standards for the management of the agricultural business? In my opinion, it is crucial for the top 20 percent farmers to take active action here and show the way. I think they currently struggle to find concrete actions they can take, as the EU taxonomy is not direct enough for the individual farmer.
@Anders
This is a very relevant question. It is not sufficient just to develop a tool that calculates a farm’s carbon footprint, to be really helpful it should also provide advice on relevant farm management practices.
I am most familiar with the Irish situation where there is a strong AKIS including farm advisory system. It developed the Carbon Navigator tool to help livestock farmers reduce their GHG emissions, with a focus on practice changes at farm level. You can see the example of the Beef Carbon Navigator here https://www.teagasc.ie/media/website/publications/2019/Bord-Bia-Beef-Carbon-Navigator-LR4.pdf or see this presentation on the Carbon Navigator here here http://enrd.ec.europa.eu/sites/enrd/files/tg2_beca_teagasc_murphy.pdf. This first version, which was developed back in 2013, has a specific focus on win-win practices through improved efficiencies that can also improve the farm return. I understand Version 2 is scheduled for release this year and hopefully will also embrace land use and land use changes.
I suspect similar apps may be available and in use in other countries.Last year researchers at Scotland’s Rural College published a comparative analysis of farm-based carbon audits https://www.climatexchange.org.uk/media/3584/farm-based-carbon-audits-final.pdf.
Some years ago researchers at the Joint Research Centre published a paper on the development of an EU-wide farm level carbon calculator https://setac.onlinelibrary.wiley.com/doi/pdf/10.1002/ieam.1629 that also included recommended mitigation actions. I wonder if the Commission has this app in mind in its draft Farm to Fork Strategy when it recommends the development of a low-carbon farming manual as the basis for payments and labelling.