Each year, the Commission presents a report on the distribution of direct aids to agricultural producers (links are provided on this web page). In this report, the Commission presents the breakdown of direct payments by Member State and size-class of aid. It is the source for the graphs which compare the cumulative amounts of payments with the cumulative number of beneficiaries.
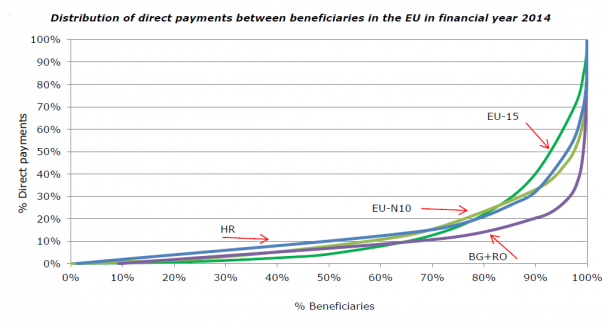
The graph from the most recent report for the 2014 financial year (thus covering direct payments made to farmers in 2013 as Member States are reimbursed in the following financial year) is shown below. It confirms that the oft-quoted statistic that 80% of direct payments go to just 20% of farmer beneficiaries is alive and well; indeed, the distribution is even more skewed in Bulgaria and Romania than in other Member States.
Measures included in the 2013 CAP reform to equalise payments per beneficiary
The 2013 CAP reform attempted to reduce the degree of inequality in the distribution of payments through two mechanisms, degressivity/capping and the redistributive payment. We will not see the impact of these two measures until the Commission publishes its next report which will give information on the distribution of payments made to farmers in 2014, the first year of implementation of these reforms. However, do not expect any dramatic changes.
Degressivity required Member States to reduce basic payments over €150,000 per farm by a minimum of 5%. Member States could opt for any reduction percentage up to 100% (capping), and nine Member States have opted to cap payments at amounts between €150,000 and €600,000. To avoid disproportionate effects on large farms with high employment numbers, Member States could take into account salaried labour intensity when applying the mechanism. The amount of money affected by degressivity/capping is, in practice, very limited. The total amounted to €109 million in 2015, almost two-thirds of which is accounted for by Hungary.
A potentially more equalising measure was the new voluntary possibility to pay a redistributive payment on the first hectares farmed. Up to 30% of a country’s national ceiling could be devoted to this, and eight Member States have implemented it. The amount involved in the redistributive payment is larger than that affected by degressivity/capping, amounting to €1.25 billion in 2015. Because this redistribution is financed by a reduction in the basic payment to all farms, its impact on the overall distribution of payments among farms will also be limited.
Distribution of direct payments by farm income levels
The Commission’s presentation of the direct payments data sorts the distribution according to the size of the individual payment made to each farmer. However, it does not tell us whether it is richer or poorer farmers (in terms of income from farming, not overall income) who receive the largest payments.
Most of us will intuitively assume that the largest direct payments go to those farms with the largest farm incomes. This is broadly correct, but there are exceptions. Direct aids are linked to land area. Some farm enterprises can be high value (and high income) while having relatively few eligible hectares and thus be in receipt of relatively small direct payments, e.g. horticulture, vineyards and intensive livestock production. Conversely, extensively-grazed upland farms might be recipients of large direct payments because of their large areas but have low farm income because of the inherent unprofitability of this production.
Sorting direct payments by the income level of farmers allows us to see the share of direct payments going to those with farm incomes above a certain threshold. It is one thing to cap individual farm payments above a certain size. One could also argue that any payment to farmers with incomes above a certain level should be capped, regardless of the size of the individual payment. If the purpose of the basic payment is farm income support, why should the taxpayer make any transfer to farmers with a farm income above, say, twice the average income in a Member State?
I raise this question even though this is not a course of action that I would recommend. With over 40% of EU farmers having an additional off-farm income, as well as many others in receipt of state pensions and other state welfare payments, the income generated by the farm is not a valid indicator of income need.
Also, if a farmer’s direct payments were dependent on the income it reported, we could anticipate a lot of creative book-keeping and rising employment for accountants. Nonetheless, in the absence of better figures, it is of interest to ask what share of direct aids is paid to farmers with a farm income above particular thresholds.
Data on direct payments by farm income levels
Matching direct payments with the income earned from farming requires the use of farm accounts data, and specifically the DG AGRI FADN database. To perform the analysis properly would require access to the individual farm accounts in the FADN database. This is not normally available. Instead, FADN makes available aggregated data in its public database which can help to throw some light on this question.
The most useful aggregation for this purpose in the FADN database is the classification of farms by economic size class. The notion of economic size class is defined in the Union’s typology of farm holdings on the basis of its potential gross production (total standard output). Holdings are classified in economic size classes based on their total standard output, the limits of which are expressed in euro. In the FADN public database just six economic size classes are shown. The raw data which I have extracted from the database are shown in the following table. I have chosen Farm Net Income as the farm income indicator, while direct payments are the sum of decoupled payments plus total subsidies paid to crops and livestock.
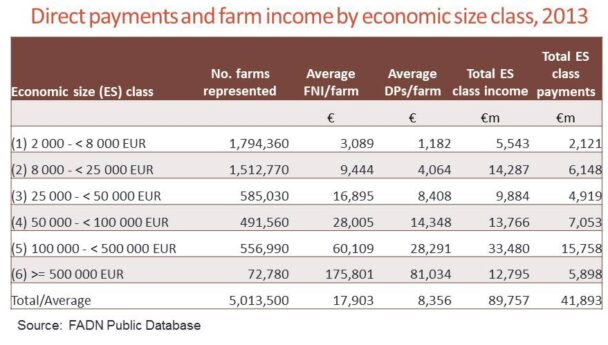
Unfortunately, it is not a simple matter to compare distributions derived from the Commission’s data and the FADN database. The Commission distribution is based on the expenditure paid as direct aid according to Regulation (EC) No 73/2009 aggregated by every individual beneficiary identification code (‘unique identifier’) assigned through the Integrated Administrative Control System (IACS). The Commission 2014 report on the distribution of direct payments covered €41.7 billion in direct payments to 7.52 million beneficiaries in 2013.
The FADN database is based on a sample of commercial farms so it is representative of 5.0 million holdings in the EU-28 (for comparison, Eurostat enumerated 10.8 million holdings in 2013). Many of the very smallest holdings counted by Eurostat but excluded from the FADN sample are also excluded from receiving direct payments. However, around 2.5 million beneficiaries of direct payments are not included in the FADN database. These are presumably farms which produce less than €2,000 of total standard output annually.
From the annex to the 2014 Commission report it is possible to work out that the 2.5 million farms that received less than €500 each in direct payments received only €647 million between them (tables on page 5/24). The other 5.0 million farms shared the remaining €41.0 billion. This total is very close to the total direct payments received by the 5.0 million farms represented by the FADN sample of commercial farms (estimated at €41.9 billion in the table above). Despite the differences in the approach to deriving these figures, we will proceed by assuming that these two sets of figures represent the same farms.
Results for the distribution of direct payments by farm income levels
In order to construct a cumulative distribution of payments ranking farms by their income analogous to the distribution in the Commission report ranking farms by the size of the payment received I convert the 6 economic size classes into 10 income deciles. To this this, I make the simplifying assumption that each farm in each economic size class earns the average income and receives the average direct payment for that size class. In practice, the error introduced by this assumption is not likely to be very significant.
The resulting distribution (shown below) is less unequal than the distribution shown above taken from the Commission’s report. Instead of the 80-20 split shown when we rank beneficiaries by the size of their payments, the distribution is now more 60-20. That is, the 60% of farms represented by the FADN sample with the lowest incomes receive 20% of the total direct payments.
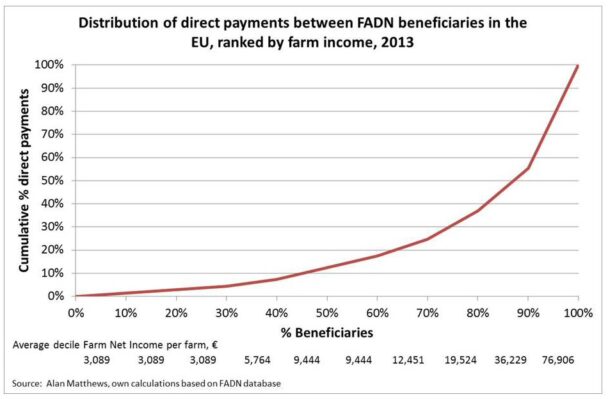
The main explanation for this is that the FADN sample excludes the 2.5 million payment beneficiaries with very low payment levels and presumably very low incomes from farming. We next consider the impact of including these 2.5 million farms as a new economic size class (< 2000 EUR) along with the 5.0 million farms represented by the FADN sample. We learned above that their total direct payments amounted to €647 million. For all farms represented by the FADN sample, farm net Income is just over twice the direct payments received, but for the very smallest size class it is almost three times the direct payments received. Let us assume therefore that the farm income of these 2.5 million farms amounts to €1.94 billion (three times the amount of their direct payments). We now add these farms as a new economic size class (< 2000 EUR) by adding both the total farm income and total direct payments figures to the FADN totals and reconstruct the distribution as before in terms of deciles. The resulting distribution is shown in the figure below.
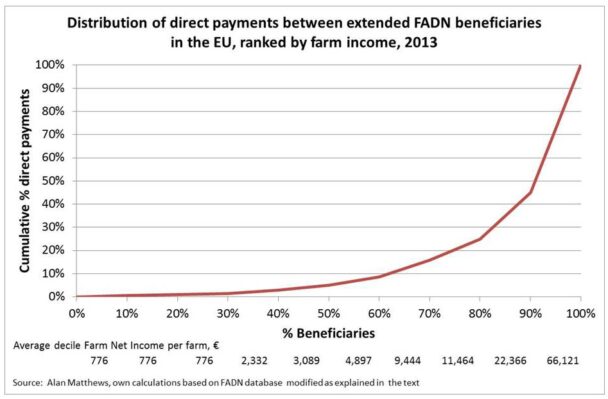
This distribution is now much closer to the one in the Commission’s report, albeit still somewhat less unequal – the 80% of farmers with the lowest incomes receive about 25% of total direct payments. This could be due to the simplifying assumption I made that all farms in each economic size class had the same farm income and received the same direct payments when constructing the deciles. However, the fact that some farms with small incomes from farming may receive relatively large amounts of direct payments, while some farms with large incomes from farming may receive relatively low amounts of direct payments, would tend to make this a more equal distribution than the one shown in the Commission’s report in any event.
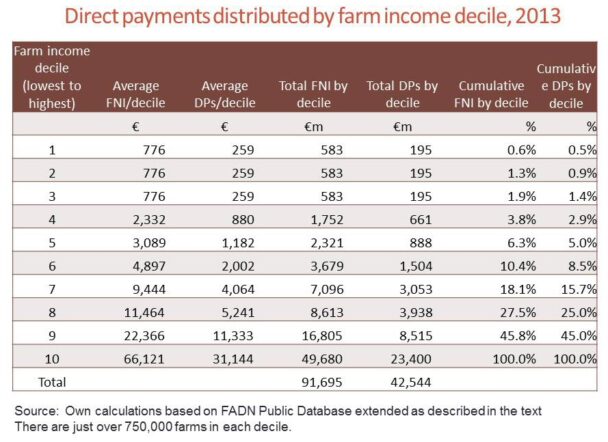
My approximation to the distribution of direct payments by farm income class by decile is shown in the final table below. The total amount of direct payments allocated over the ten deciles (€42.5 bn) is slightly greater than the actual amount reimbursed to Member States for the payments made in 2013 (€41.7 bn). Nonetheless, the numbers look plausible and, to my knowledge, this is the first time the direct payments data have been presented in this way.
Conclusion
What the numbers show is the highly unequal distribution of direct payments across income groups as for beneficiaries. Around 55% of all direct payments go to the 750,000 farms in the top decile with the highest farm income. If we take the median farm (dividing the 5th from the 6th decile, just 5% of direct payments go to farms with incomes below the median farm, while 95% of payments go to farms with incomes from farming above the median. Added 27 August: Fun fact. As CAP direct payments account for 28% of the EU budget, these 750,000 farms with the highest farm incomes share 15% of the entire EU budget among them.
If indeed direct payments are intended to support the incomes of farms with low farm incomes (defined as those with incomes from farming below the median), it is a highly ineffective policy. As said so often before, problems of low incomes among farmers and rural poverty are best addressed by direct income support and social welfare policies, not by agricultural policy.
For those interested, the spreadsheet showing the calculations to derive this distribution is available here.
This post was written by Alan Matthews
Picture credit: Flickr, Democracy Chronicles and used under Creative Commons licence


This highlights the need for clear objectives. There are relatively few farmers in the UK who do not have other sources of income if only investments or property lets. Smaller farms with lower economic return from the land would be expected to have other income sources if they are to survive and are LESS dependent on farming. But these producers often make the same contribution to the food supply and environment as the higher income producer. The question is perhaps should the subsidy hungry be seen as being in need of help or lacking ambition?