

A paper just published in Nature Food by researchers from the EU Joint Research Centre (JRC) and FAO has for the first time provided a consistent database of food system greenhouse gas (GHG) emissions globally and for every country with yearly frequency for the period 1990-2015. The authors justifiably claim that it represents a milestone in our understanding of how the global food system has developed. This post looks at some of the main messages provided by the paper.
It is first important to understand what the data are measuring. Although they cover food system emissions, these data are not consumption-based food system emission estimates or footprints. There is no international trade in the estimating framework. The emissions from animal feed imported from one country to another, or deforestation in one country caused by the export of beef to another country, remain attributed to the source country and not with the country of consumption. The data are thus consistent with the production-based or territorial accounting system used in national inventories.
The paper is based on the EDGAR global emissions database version 5.0 maintained by the JRC and the Netherlands Environmental Assessment Agency (PBL). This provides emissions using the standard IPCC source categories including Agriculture on a territorial basis as well as emissions from international transport. As this is a harmonised database, the data are not drawn from the national inventory reports submitted by countries to the UNFCCC but are based directly on activity data multiplied by mostly Tier 1 emissions factors as estimated by the IPCC. The activity data for the Agriculture sector are drawn from FAOSTAT.
The EDGAR 5.0 database is extended in two directions. First, emissions due to land use and land use change (LULUC) but not forestry are included based on FAOSTAT figures. Second, and more interestingly, it identifies emissions arising from a country’s Energy, Industrial and Waste sectors that are linked to food system activity.
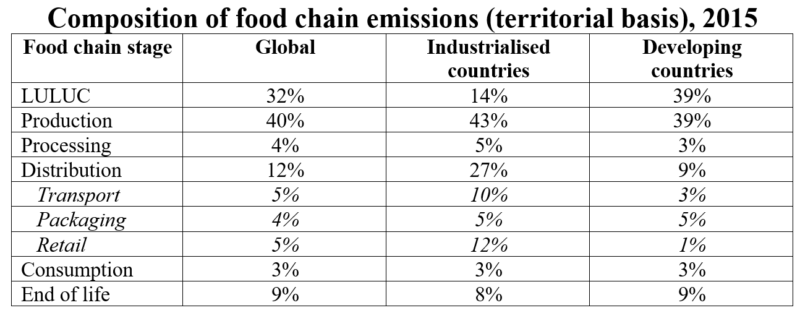
The result is a database, EDGAR-FOOD, that provides a two-way breakdown of territorial food system emissions. One decomposition presents a breakdown of food system emissions arising at different stages of the food chain where six stages are identified: 1) LULUC: land use and land use change; 2) production: primary production of food commodities, including the production of inputs such as fertiliser; 3) processing: food processing; 4) distribution: food distribution including packaging, transport and retail; 5) food consumption: including domestic activities of food preparation; and 6) end of life: end of life of food, including food residues management and management of non-food residues used in previous food system stages.
The other sectorial disaggregation in based on the food system structure, distinguishing four sectors: 1) land-based sector, including crops and livestock production and LULUC; 2) energy; 3) industry; and 4) waste. The contribution of the database is to calculate how much of the total emissions from these various sectors is due to the food system (for example, for primary agriculture in the land-based sector, emissions from the cultivation of non-food crops are removed).
Key messages
The paper estimates that a third of global GHG emissions comes from the food system. Its estimate of the contribution of food systems to total anthropogenic GHG emissions was 34% for the year 2015 (for comparison, the IPCC Special Report on Land and Climate Change estimated the share at between 21% and 37% of total GHG emissions). Note that all the estimates quoted in this post and taken from the paper are just that, estimates, and come with a margin of uncertainty. The paper itself reports uncertainty ranges but in reporting the figures here I have omitted these uncertainty bands. All estimates are based on aggregating different gases to CO2e equivalents with the GWP100 values in the IPCC Fifth Assessment Report, AR5.
Global GHG emissions from the food system were 18 Gt CO2e in 2015, with 27% (or 4.9 Gt CO2e) emitted by industrialised countries and the remaining 73% (or 13 Gt CO2e) emitted by developing countries including China.
Examining the trend over time, food system GHG emissions increased from 16 to 18 Gt CO2e between 1990 and 2015 (an increase of 12.5%). At the same time, global food production, taking cereals as a proxy, increased by over 40%, indicating an overall decrease in the emission intensity of food during the same period.
Emissions from non-food activities increased at a much faster rate so the food system share of total GHG emissions has decreased over time from 44% in 1990 to 34% in 2015. These trends differ between industrialised and developing countries. The food system share was stable and relatively low for industrialised countries (around 24%). On the contrary, in developing countries the share of food system emissions significantly decreased, from 68% in 1990 to 39% in 2015. Weighting these two shares gives the global share of 34% in 2015.
What is interesting is the distribution of food system emissions by stage in the food chain. In 2015, 72% of global GHG emissions from the food system was associated with the land-based sector (agriculture and LULUC). In industrialised countries, the contribution of the downstream sectors beyond the farm gate (43%) was much larger than in developing countries (24%) and is as big as the share coming from primary production (including the production of inputs).
The share of transport and retail emissions is much higher in industrialised countries (the former mainly in the form of regional road transport and the latter driven by refrigeration), while the share of LULUC (which includes deforestation) is much higher in developing countries. In both country groups, there is a high contribution of around 9% from end of life emissions when waste and waste products are disposed of.
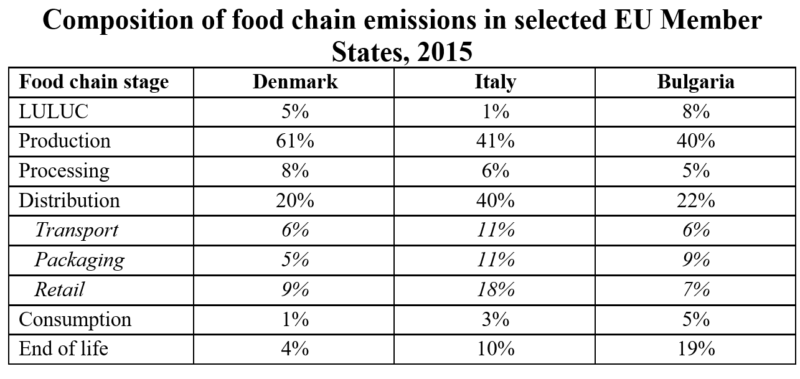
An Excel file in the Supplementary Information provides disaggregated data by country over time. The following table shows the same food chain data for three EU Member States chosen to represent different stages of development. Despite having the highest income per head of the three selected Member States, Denmark has the lowest proportion of food system emissions arising in the downstream sectors. This could reflect the high export orientation of Danish agriculture, its high share of renewable energy, and the high awareness around waste management policy. Italy stands out for the very high share of its food system emissions generated in distribution, while in Bulgaria the stand-out feature is the high share of emissions coming from end of life disposal.
Disaggregating food system emissions in this way can help to identify ‘hotspots’ in a country’s emissions profile where efforts to reduce emissions could be intensified.
This post was written by Alan Matthews
Photo credit: Camy West via Flickr, used under Creative Commons licence

Dear Alan, many thanks for your analysis.
I looked at the supplementary tables provided in the article, and I am puzzled by some data. For instance, according to ST4, food systems in 2015 accounted for 81% of total GHG emissions in Brazil, 20% in Germany and 46% in France. Hard to judge, of course, but I just wonder if this is credible.
@Well-spotted, Jean-Christophe. One could understand the Brazilian figure as indicating very high LUC emissions related to food systems, but even here I note that the 1990 share for Brazil was 99%. Also, the high and rising share in France over time is hard to explain. Obviously best to contact the authors directly to get their explanation, but would be great to share any additional information you receive.