Further note on EU farm income trends

In my previous post, I discussed recent EU farm income trends based on recently-updated Eurostat data. Earlier this week, DG Agriculture and Rural Development released an update of its CAP Context Indicators. These are part of a set of CAP Indicators linked to output, results and impact which are aimed at measuring the effects of policy measures (the value of these indicators is discussed by Koester and Loy in this post).

The Context Indicators are intended to monitor general contextual trends in the economy, environment and society which may affect the performance of the CAP. There is a wealth of useful information in the short fact sheets which accompany each indicator.… Read the rest

Recent trends in EU farm incomes

Earlier this month, without any fanfare, Eurostat produced its estimates of farm income for 2015 (see its database domain aact_eaa06 under the Economic Accounts for Agriculture, EAA). Given the noisy campaign by the farm lobby in recent months for additional support to the sector, one would expect the figures to show a sector in dire straits, reeling from crisis. There are, of course, individual sectors in trouble. There are individual member states where farm incomes over the past two years have taken a very serious hit. And there are individual farmers in all sectors, particularly those who are heavily borrowed, who have run into financial difficulty.… Read the rest

The use of CAP impact indicators for policy evaluation

This post is written by Ulrich Koester and Jens-Peter Loy

According to new legislation, the European Commission (EC) is in charge of evaluating Pillar 1 measures of the Common Agricultural Policy (CAP), while Pillar 2 measures have to be evaluated by the Member States (MS). Pillar 1 measures are of utmost importance for EU expenditure, amounting to a share of about 40% of the total expenditure of the EU budget. The request for evaluation is a significant step forward. One may wonder whether this new task indicates that the measures of the CAP have not been evaluated regularly so far. In the following, we focus on one specific measure, direct payments, for two reasons.… Read the rest

Rising Agricultural Incomes in Europe

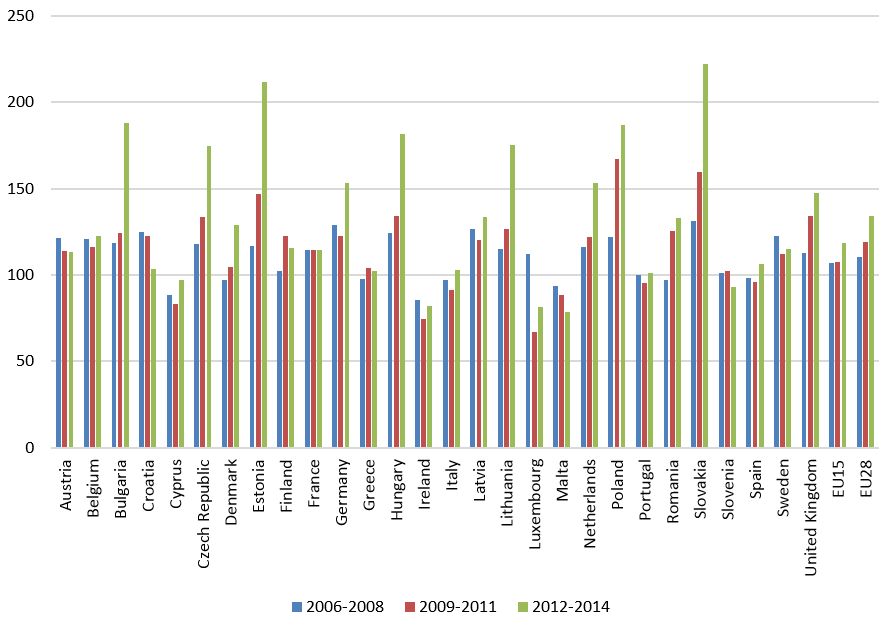
The index of the real income of factors in agriculture per annual work unit (better known as index of agricultural income or Indicator A) has increased by 18% in EU15 countries and 35% in EU28 countries from 2005 to 2014 as evident from Eurostat statistics. It is clear from the figure below that compared to 2005, agricultural incomes more than doubled in Estonia and Slovakia in 2012-2014, while it was just decreasing in Cyprus, Ireland, Luxembourg, Malta and Slovenia.

Agricultural income in the European Union by member state, 2005-2014 (2005=100)

Source: Own composition based on Eurostat 2015 data.

Without going very much into detail, it is apparent that agricultural income has been increasing in each period in the majority of the cases.… Read the rest

Eurostat preliminary farm income figures for 2009

Eurostat has just published its first estimates for real agricultural income per worker in 2009. For the EU27, the figure is down 12.2% on the 2008 figure, but with considerable variation across countries, from -35.6% in Hungary to +14.3% in the UK. While differences in commodity price trends and variations in commodity composition across countries will account for much of the variation, other factors include the further phasing in of direct payments (in the NMS) and currency fluctuations against the euro (important in explaining the UK trend).

Eurostat also publishes a comparison of trends since 2005. Choosing any one year as a base is always problematic, given the possibility that the base year is an untypical year.… Read the rest