
A variety of estimates of the level of farm support circulate. Many of them rely on creative accounting. For example, during the recent farm bill debate in the US Senate on C-Span television, a Senator claimed that the EU subsidized its farmers seventeen times more than the US, quoting as “evidence” that farm subsidies accounted for 45% of the EU budget, while by contrast the US farm spending was less than 1% of the US federal budget. On the opposite, the Momagri (a French arable crops producers sponsored think tank) published estimates that US farm support was three times higher than the EU one. Defining meaningful indicators is important since, on both sides of the Atlantic, the fact that the other party supports its farmers is used as an excuse to maintain, increase or “re-couple” support. In the EU Parliament, for example, more and more MEPs seem to be arguing for maintaining support and even make it more countercyclical payments mostly because “the US does it”.
There are several conceptions of farm support. For example, a lower bound estimate of CAP transfers is the budgetary cost of direct payments to producers. In order to capture all direct transfers to farmers, one can also add pillar 2 payments (even though one can argue that they compensate the costs of environmental constraints). Figures get larger if one takes into account guaranteed prices and border protection that result in a transfer from consumers to farmers (EU tariffs on beef cuts exceed 100% for example). One should also account transfers such as subsidized interest loans for farmers in some Member states which do not appear in the EU budget. Tax exemptions on fuel for farmers are also a considerable and opaque form of subsidies, to say nothing about the contradiction with the posted environmental ambitions of the CAP.
There is a grey area on what should be included in the indicators. Considering the whole transfers to the sector rather than the one targeting only the individual farmer, is useful for international comparisons since in some countries, education, training, research, etc. are paid by farmers while they are government funded in others. However, counting subsidies to agricultural education, is debatable given that only a small proportion of the students trained actually end up becoming farmers in a country like France. Public support to certification and disease control benefit to consumers more than farmers. It is also unclear whether food aid programs, and in particular the huge US food stamps one should be counted as farm support. Such policies do contribute to raise farm prices, but so do welfare (in cash) payments that nobody would think of considering as farm subsidies. Biofuel programs also have a large impact on prices. Still, none of the international organizations that are mandated to measure farm support take them into account. One reason is that they tend to raise the price of feedstocks for all producers, and not only the domestic ones. And that they have other stated objectives than supporting farm incomes.
The OECD (Organisation for Economic Co-operation and Development) has developed a consistent methodology to deal with these issues and variety of indicators. The most well-known ones are the Producer Support Estimate (PSE), which counts all transfers to (individual) producers and the Total Support Estimate (TSE) which includes also transfers to general services. The WTO (World Trade Organization) uses a different methodology to monitor the Aggregate Measurement of Support (AMS), which focuses on those payments that have externalities on third countries, mostly because they encourage production. The WTO also monitors environmental payments and general services outside the AMS. Both the PSE and the AMS include estimates of costs paid by consumers. Indeed, budgetary transfers are simpler to measure but they ignore the support provided through guaranteed prices, and do not allow meaningful comparisons of support between countries.
A new report commissioned by the European Parliament (EP) looks at the different approaches to measure farm support. It is rather critical of the methodology used by the WTO, which has little economic meaning. When the WTO indicator was defined, some countries (including the EU) insisted to measure market price support against a fixed benchmark, unchanged since 1995. The result is that the EU, for example, is still registered as supporting its wheat when the world market price of wheat exceeds €200, just because its (inactive) intervention price of €101 exceeds this historical benchmark. The authors of the EP report are also critical of some of the aspects of the OECD methodology, even though they consider that the OECD dataset is the most reliable source of information available. They used a modified version of the PSE methodology, in particular to construct measures of “real support” which controls for exogenous currency fluctuations.
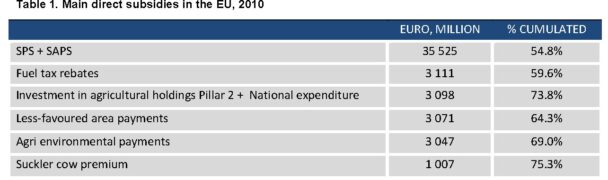
The study finds that when one focuses only on direct payments, the different sources are rather consistent. Data from the economic accounts and from microeconomic sources lead to larger figures than the one derived from the EU budget, because of subsidies at the Member state level, namely capital subsidies. The PSE leads to larger figures since it accounts for market price support (even though the latter has decreased considerably over time) but also for tax deductions, in particular on fuel. Fuel subsidies are the second largest payments to farmers, right after the single farm payments (SPS and SAPS). It is rather surprising that the level of such subsidies, hardly in line with the posted objective of “greening” the CAP, exceeds the sum of agri-environmental payments in the EU.
The EP study concludes that the EU subsidizes its farmers at a level which is similar to the OECD average, roughly in the same proportions as Canada, Russia and China (according to preliminary figures in 2010). The rate of support is nevertheless much higher than the US one. Regarding the composition of support, the EU has progressively shifted its support to more decoupled payments, which have little impact on the world market. At the same time, the US has kept and even developed instruments that remain function of the market situation. Emerging countries have also recently developed coupled instruments. The comparison over the recent period should account for the fact that the US support depends a lot on market situation. The level of US support in the most recent period appears relatively low, but it is largely a consequence of high world prices. Should prices go down, the corresponding support would inflate rapidly. The Canadian system also relies a lot on insurance payments.
Switzerland has progressively shifted farm subsidies towards support to the provision of public goods. The conditionality of direct payments to environmental conditions is more ambitious than the “ecological focus” measure proposed by the Commission in October, if one accounts for side measures.
In real terms, Chinese farm support is more than twice the total amount granted by both the EU and the US, if one believes the 2010 figures (still provisional and possibly subject to revision). The increase in farm support in Russia, Ukraine and to Brazil is also noteworthy. Emerging countries, and in particular China, also grant very large public support to the sector as a whole, through infrastructure, research and extension.
The main conclusion of the study is that the EU spends a considerable amount of money supporting farm incomes. At the same time, Switzerland supports the provision of public goods, with payments that are subject to much more drastic environmental conditions. The United States and, to a lesser extent Canada, focus on protecting farmers from adverse conditions, with a support that becomes more and more an insurance against poor yields and lower prices. And emerging countries such as Brazil and China invest heavily in infrastructure and research, preparing the future. One might think that there are lessons to be drawn for the future CAP. But do not be too optimistic. Conservative forces are powerful, and the CAP seems in no direction for a major change.
The EP study by Butault et al is available here.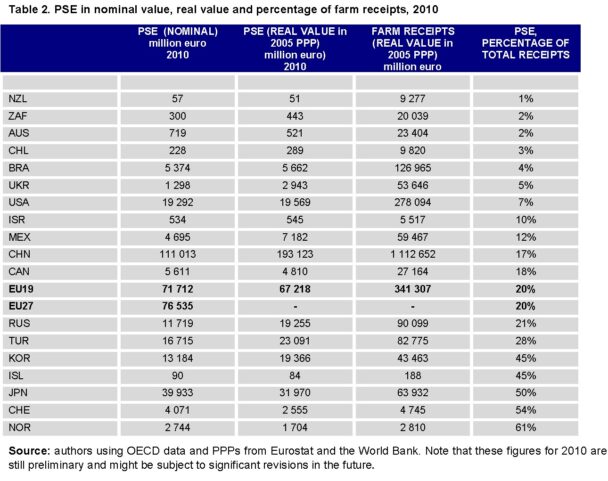
This post was written by Jean-Christophe Bureau.
