

Unlike in its presentation of its proposal for the current MFF in 2011, the Commission on this occasion in presenting its proposal for the 2021-2027 MFF did not provide comparative details on ceilings in the last year of the earlier MFF.
There are some understandable reasons for this. The next MFF is designed for 27 Member States without the UK, and so is not directly comparable with the current MFF. Also, the Commission has proposed a different and more simplified structure for the MFF which makes direct comparison difficult.
Nonetheless, in the absence of a column showing 2020 ceilings for the various MFF headings, it is not straightforward to try to work out whether the 2021-2027 figures represent an increase or decrease in proposed commitments and by how much. The Commission did not help its case by providing briefings on what these increases or decreases might be but only in current prices, thereby mixing up the effects of inflation and real changes in the volume of expenditure.
It should therefore not be a surprise to the Commission that this lack of transparency led stakeholders to smell a rat and complain of dirty tricks. The European Parliament’s Committee on Budgets complained: “Commission figures are part of a political narrative rather than of a fair and transparent budgetary proposal. Without a common methodology between the three institutions, no comparisons nor proper negotiations can take place.” It requested more detailed background figures from the Commission to enable proper comparisons to be made.
In the absence of official figures, various analysts have made their own comparisons for the CAP budget, including Farm Europe, Bruegel, the Committee on Budgets and my own effort here. The general consensus has been that the proposals imply a cut of around 15% in real terms in the CAP budget, although the analyses have differed on how this reduction is allocated between the two Pillars.
The Commission has now responded to the request of the Committee on Budgets indicating how the 2021-27 figures for the various MFF headings (including the CAP) compare in both current and constant price terms with the 2014-2020 MFF excluding the UK. Its recent figures provide some clarification, but also give rise to further questions.
The MFF 2014-2020
To enable us to better understand the Commission figures, it is first useful to provide a table showing the MFF 2014-2020 ceilings by year for both EAGF (Pillar 1) and EAFRD (Pillar 2) ceilings in both current and constant 2011 prices.
Member States had the possibility to move resources between Pillars on a voluntary basis in the current MFF. In net terms, this led to an increase in EAFRD resources and a reduction in EAGF commitments. The CAP in the future MFF programming period may also allow such flexibility, but this is not yet reflected in the Commission’s MFF 2021-2027 figures.
Note, in particular, that commitments for both EAGF and EAFRD before flexibility and reprogramming are evenly spread throughout the programming period in current prices, but are falling in constant prices.
This raises the question whether comparisons should be made between the future MFF (without flexibility) with the current MFF before or after flexibility is taken into account? The like-with-like comparison would be to compare the ceilings before flexibility. However, the Commission in its latest figures makes the comparison after flexibility. For reasons I will explain, this affects the calculated percentage changes even for the CAP as a whole in constant price terms. It also affects the distribution of these changes between the two Pillars. If the future MFF amounts (without flexibility) are compared to the current MFF amounts (after flexibility in favour of the EAFRD), any calculated increase in the EAFRD budget will be smaller, and any calculated decrease will be greater. Conversely for the CAP Pillar 1 budget.
Table 1 below shows the current MFF both before and after the flexibility between Pillars. The table also captures the impact of the late adoption of Rural Development Programmes in 2014. These delays did not permit to allocate the full amount of commitment appropriations originally foreseen. As a result, commitment appropriations for the EAFRD were reduced in 2014 and correspondingly increased in 2015 and 2016. Flexibility does not have any impact on the overall CAP budget (€408.3 billion in current prices, €362.8 billion in constant 2011 prices) but simply re-allocates €4 billion between the two Pillars.
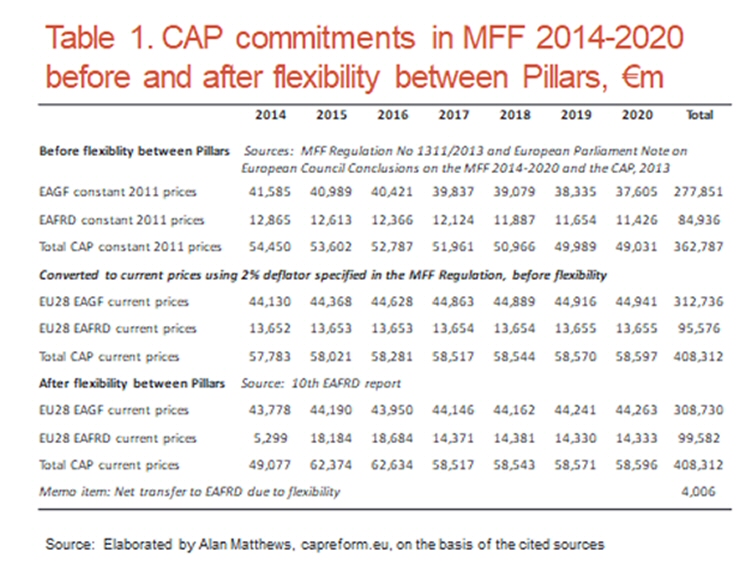
(click on table for clearer image)
The Commission’s MFF comparisons
Table 2 summarises the information that the Commission has made available on the CAP, in both constant and current prices. The Commission uses two approaches to make the comparison between the two MFFs. One is to compare the total budget envelope in both periods. The other is to derive an MFF 2014-2020 figure by taking the last year in that programming period, 2020, and multiplying it by 7.
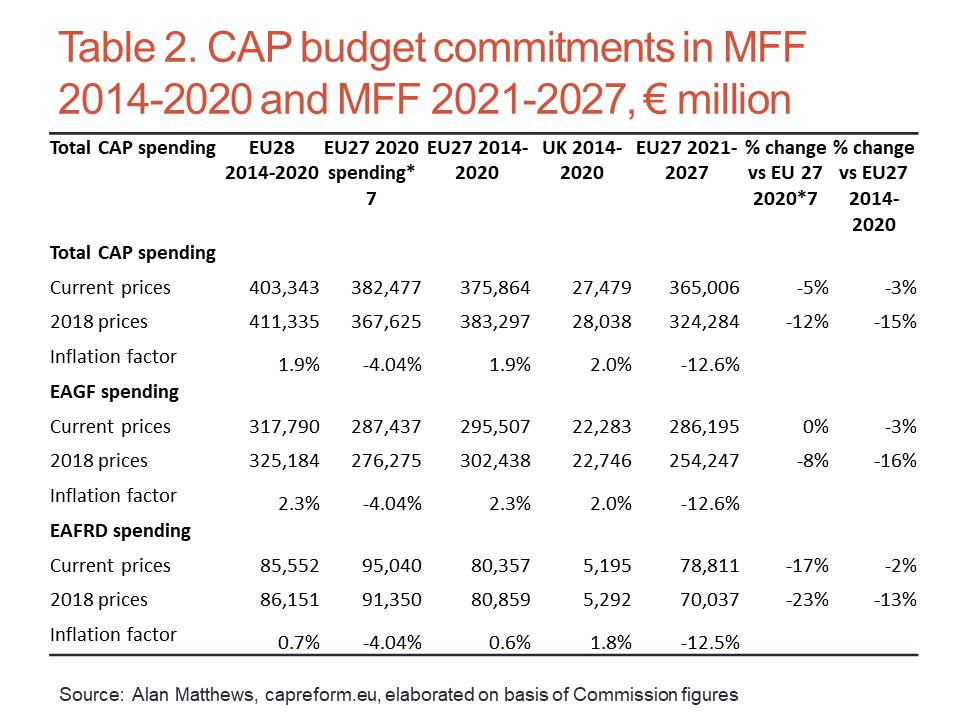
If MFF commitments are spread evenly through the 2014-2020 programming period, and if inflation is constant, then both bases of comparison should give the same percentage changes when compared to the MFF 2021-2027 allocation. If commitments are increasing through the 2014-2020 programming period, then the 2020*7 allocation will give a higher base for comparison with the MFF 2021-2027 allocation. Conversely, if commitments are decreasing through the 2014-2020 programming period, then the 2020*7 allocation will give a smaller base for comparison with the MFF 2021-2027 allocation.
Some of the key conclusions from the Commission’s table can now be highlighted. First, the figure of a “less than 5% reduction in the total CAP budget” quoted by Commissioner Hogan in his statement after the publication of the Commission’s proposals refers to the nominal cut in current prices. The only slightly anomalous figure here is that EU28 MFF 2014-2020 commitments are given as €403.2 billion, when the figure according to Table 1 should be €408.3 billion.
The Commission also gives the comparison in real terms. In comparing the real volume of resources made available to the CAP budget over time, it might be argued that one should use the actual inflation rate as the deflator (there are various inflation measures available, including the Harmonised Consumer Price Index and the GDP deflator). However, the Commission has used the fixed 2% deflator which is mandated in the MFF Regulation to convert current to constant prices. Whether this is a good representation of the change in ‘real’ resources available for the CAP budget depends on how closely this default value matches the ‘real’ inflation rate since 2014.
The implicit inflation factors used to convert commitments between current prices in the MFF 2014-2020 and constant 2018 prices are also shown in Table 2. For the column ‘EU 27 2020 spending*7’, the inflation factor to convert 2020 current prices to 2018 prices is -4.04% for both Pillars. This is the percentage change over two years derived from using the default 2% fixed inflation rate to convert current price amounts to constant 2018 prices.
That inflation factor is calculated for a single year (2020) which makes it easy to interpret. For the full period 2014-2020 the inflation factors are different for Pillar 1 and Pillar 2 commitments. There is a much lower inflation factor reported for EAFRD commitments (0.7%) compared to EAGF commitments (2.3%). In this case, both inflation factors are positive.
The fact that the inflation factors are positive when converting current prices in the 2014-2020 period to constant 2018 prices results from two opposing tendencies. Converting commitments in current prices in the years 2014-2017 to 2018 prices (assuming a positive inflation rate) will result in raising these amounts. Conversely, converting commitments in current prices in the years 2019-2020 to 2018 prices will result in lower amounts. If the conversion were being made to 2017 prices (the mid-year of the programming period), if current price amounts were committed evenly over the period, and/or if the inflation rate were the same in each year, then the inflation factor would be zero. Because we are converting to 2018 prices which is closer to the end year of the period, the 2018 constant price figure is somewhat higher than the current price figure.
The fact that the inflation factor is smaller for EAFRD commitments than for EAGF commitments, in turn, is due to the different scheduling of these commitments in current prices once flexibility and, more important, the reprogramming of the unused commitments in 2014 in Pillar 2 are taken into account (see Table 1). This is important to the outcome when combined with the fact that the inflation rate has been different in each year.
If we are interested in comparing the Commission’s intentions in both periods, it would be better to use the initial MFF 2014-2020 amounts as the base. However, if we want to compare the Commission’s proposal with the actual commitments made available in the current period, then the Commission’s approach in using the schedule of commitments after reprogramming is appropriate. In this case, however, the decisions of Member States on the transfer of resources between Pillars, if allowed in the legislative proposals due at the end of this week, have yet to be taken into account.
What the Commission’s calculations tell us
In real terms, the Commission’s conclusions on the reduction in the total CAP budget are in line with those reached by outside analysts, namely a reduction in total budget resources of around 15% and a reduction compared to the 2020*7 baseline of 12%. Note that, when measured in constant prices, the cut compared to the 2020*7 base is smaller than when compared to total MFF 2014-2020 commitments. The opposite is the case in current prices. This counter-intuitive result results from the uneven distribution particularly of EAFRD commitments after reprogrammming over the 2014-2020 programming period.
The changes in Pillar 1 commitments are broadly in line with outside analyst’s expectations – no significant reduction in current prices (nominal terms) and a reduction of between 8% and 16% in real terms, depending on the base of comparison.
In the case of Pillar 2 commitments, the comparison with the 2020*7 base shows a reduction in current terms of 17% and in real terms of 23%, while the Commission table shows almost no reduction in the volume of resources programmed over the whole period in current prices, but a real reduction in the volume of resources of 13%.
Strikingly, when the comparison is made with the volume of resources made available over the whole of the 2014-2020 MFF period (in constant 2018 prices), the Commission table shows that the cut in Pillar 2 commitments is smaller than the cut in Pillar 1 commitments. This runs counter to the general conclusions that have been drawn from the Commission’s proposal.
The answer to this puzzle lies in the Commission’s assumption regarding the volume of resources committed to the EAFRD in current prices in the 2014-2020 MFF for the EU28. It shows a figure of €85.552 billion (Table 2). Table 1 shows that, after flexibility is taken into account, EAFRD commitments in current prices should total €99.582 billion. Assuming the same inflation factor of 0.7%, this would suggest EAFRD commitments in constant 2018 prices for the EU28 should amount to €100.279 billion rather than €86.151 billion. In both cases, this would result in larger reductions in Pillar 2 commitments than shown in Table 2.
What accounts for the missing €14 billion of EAFRD commitments? I don’t have an answer to this. Under the terms of the direct payments regulation 1307/2013. Member States could review their decisions on transfers between Pillars in order to increase the funding of Pillar 2 by 1 August 2017 to apply in the calendar years 2018 and 2019. This could be one explanation for the missing billions, but I am not aware that any Member State chose to do this. The Commission’s draft 2018 budget (admittedly published one month before the deadline in end June) did not foresee any additional transfers over and above the €4 billion arising from the decisions taken prior to 1 August 2014. This issue should be clarified by the Committee for Budgets in their continuing discussions with the Commission.
A final update
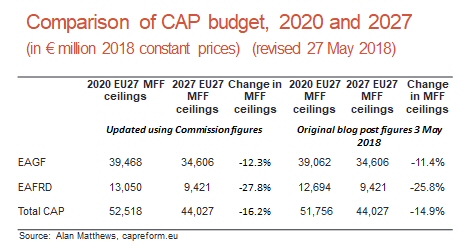
Finally, I make use of the opportunity to update my previous comparison of the CAP ceiling in 2027 under the Commission proposal with the CAP ceiling in 2020, using the 2020 figures for the EU27 in constant 2018 prices given in the recent Commission paper. The revised results show that the reductions over the next programming period, if the Commission proposal is agreed, are slightly higher than those I had initially estimated.
This post was written by Alan Matthews
Photo credit: Stevepb on pixabay, CC0 Creative Commons licence.
Update 28 May 2018: The confusion between EAGF and EAFRD in the third last paragraph has been corrected.
Update 3 July 2018: The discussion of the inflation rate used to convert current price amounts in different programming periods to constant prices has been clarified to indicate that the Commission has consistently used a 2% per annum deflator, and Table 2 has been revised accordingly.
