
Eurostat has now published its preliminary estimates for the economic accounts for agriculture in the EU for 2020. This gives us the first authoritative overview of the impact of the COVID-19 pandemic on agricultural markets and farm incomes in what has been an extraordinary year. Until now, information on monthly trends in agricultural prices and agricultural trade has given us some partial insights into the impact of COVID-19 on the agricultural sector. Despite wobbles in some sectors, by and large these indicators show that the agricultural sector has been remarkably resilient. Despite this, significant aid packages have been made available to farmers by EU Member States. These preliminary estimates of the 2020 agricultural accounts give us a status update over these developments.
The accounts confirm a small fall in the value of EU agricultural output in 2020 and a greater fall in farm income compared to 2019, although not all of this is linked to COVID. Surprisingly, there is no visible impact of the support measures put in place. This contrasts with the U.S. experience where very sizeable aid packages have increased U.S. farm income significantly. This post explores what the latest release can tell us.
Agricultural output in 2020
The following table shows the preliminary value of agricultural output in 2020 compared to previous years. The value of output of the agricultural industry declined by 1.6% compared to 2019 but was still ahead (by 0.3%) of the average of the previous three years. All in all, this suggests that the potential for COVID-19 disruption flagged at the beginning of the lockdowns – border closures and transport restrictions, shortages of seasonal workers, closures of processing plants, and the significant shift in food consumption patterns due to the closure of the food service and hospitality sectors – failed to materialise. This was due at least in part to prompt action by the European Commission at the beginning of the crisis to ensure the continued flow of food products within the single market. It also testifies to the remarkable resilience of farmers and the European food system when faced with a shock of this magnitude.
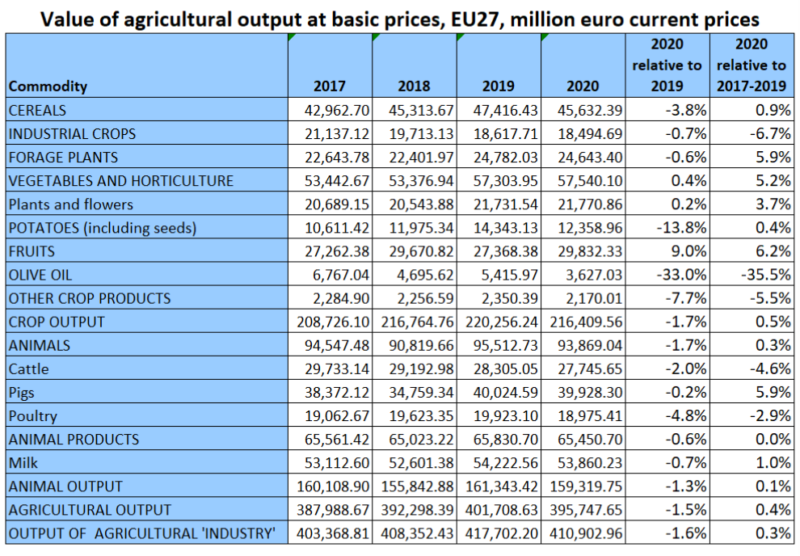
These overall figures net out the impact of different influences on agricultural markets. It is possible that a negative COVID-19 impact might be offset by more positive influences from international markets, for example. A closer look at some individual items reveals some of the wobbles.
Potatoes and olive oil stand out as two sectors that were particularly hard hit in 2020. Potatoes were affected by the drop in demand for potatoes for processing because of the fall-off in demand for French fries as fast food and other restaurants closed. This is a direct COVID-19 impact. The sharp fall in the value of olive oil output is more related to the high level of production in 2019 which led to low market prices in the first half of 2020. The U.S. has imposed tariffs on imports of Spanish table olives, but this is not a factor in olive oil prices. Global olive oil consumption was at a record high in 2020 and EU exports increased by 16% in the marketing year Oct 2019 to Sept 2020. Although the harvesting of olives is affected by reduced numbers of foreign seasonal workers, the sharp drop in the value of olive oil output in 2020 does not appear to be COVID-related.
The stability in revenues for other sectors that were thought to be adversely affected in the early period of lockdowns should also be underlined. For example, overall revenue for vegetables and horticulture, particularly exposed to vulnerabilities due to labour shortages and transport bottlenecks, was maintained. This is the case also for the flowers sub-sector despite early indications of losses in the Netherlands. On the other hand, the value of meat and milk output fell somewhat, with a particularly large fall in the value of poultry output which, again, may reflect the closure of food service outlets during lockdowns.
This relatively benign outcome for agricultural output is confirmed by the limited interest in the market support measures introduced by the Commission at the outset of the COVID-19 pandemic. Private storage aid was opened for various dairy products as well as beef and sheepmeat from 7 May 2020 and was closed for dairy products on 30 June 2020 and for beef and sheepmeat on 17 July 2020. This measure allowed the temporary withdrawal of products from the market for a minimum of 2 to 3 months, and a maximum period of 5 to 6 months. It was the only measure that involved a direct cost to the EU budget with an allocation of €80 million. Overall, the use of the private storage aid has been limited. By early November 2020, the cumulative volume of contracts concluded amounted to 18,300 tons for skimmed milk powder, 65,019 tons for butter, 43,669 tons for cheese, 1,959 tons for beef, and 15 tons for sheepmeat.
Farm income in 2020
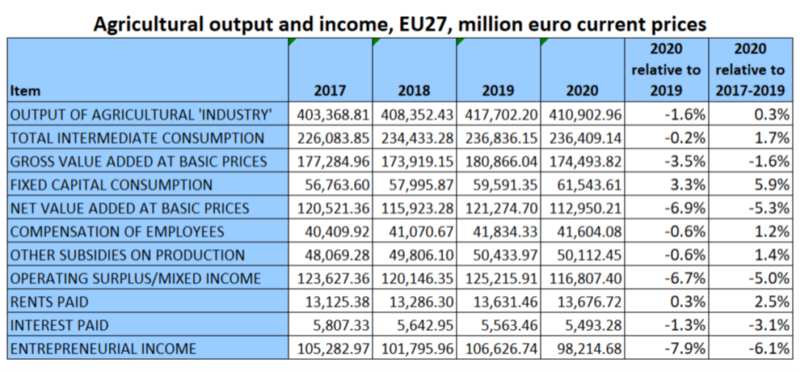
The next table shows the derivation of family farm income (‘entrepreneurial income’) in 2020. Expenditure on intermediate consumption held stable, so the decrease in agricultural Gross Value Added (GVA) at basic prices at 3.5% was larger than the fall in the value of agricultural output compared to 2019. A further rise in fixed capital consumption meant an even greater fall in net value added at basic prices of 6.9%.
Subtracting compensation of employees and adding other subsidies on production (while subtracting other taxes on production, not shown) gives the operating surplus in agriculture. Subtracting rents and interest paid (noting that rents paid show a small increase, another sign of the resilience of the agricultural sector) gives us entrepreneurial income which experienced a significant 7.9% reduction in 2020 compared to 2019. Note that the absolute reduction in the value of entrepreneurial income (€7.1 billion) is fully accounted for by the drop in the value of agricultural output (€7.5 billion). The larger percentage fall in the former reflects the amplification and leveraging of changes in income compared to changes in the value of output given the stability in intermediate consumption and other expenditures.
National changes
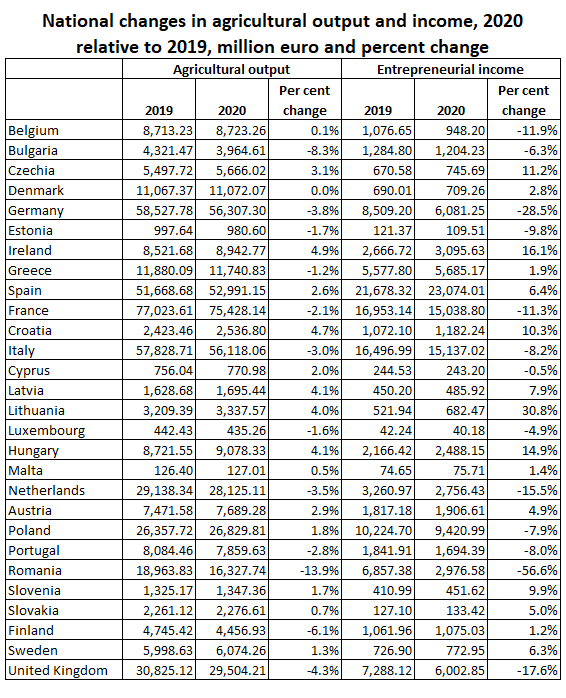
As is always the case, there is considerable variability in Member State experiences around this EU average, as illustrated in the table below. The value of agricultural output increased in several countries, although the sharp drops in Bulgaria and Romania stand out. Because entrepreneurial income is highly leveraged, its variability is much greater than agricultural output value changes. The extent to which these differences across countries can be explained by differences in the impact of COVID-19 impacts would require detailed research. The Netherlands, for example, where both flowers and potatoes were hit early on, has a more negative outcome than most other EU countries. But it cannot be assumed without more detailed analysis that the large falls in entrepreneurial income in Romania, Germany or the UK were COVID-related or not. In general, the national figures do not support the view that there was a general negative COVID-19 effect for EU agriculture as a whole.
The contribution of subsidies to EU agricultural income
The direct EU budgetary response to the COVID-19 crisis was extremely limited – the €80 million set aside for aids for private storage mentioned earlier. Otherwise, the measures taken at EU level merely permitted Member States to make use of unspent commitments in their rural development programmes and sectoral programmes. This reflected the very limited budgetary room for manoeuvre in the last year of the Multi-annual Financial Framework and the unwillingness of Member States to activate the crisis reserve.
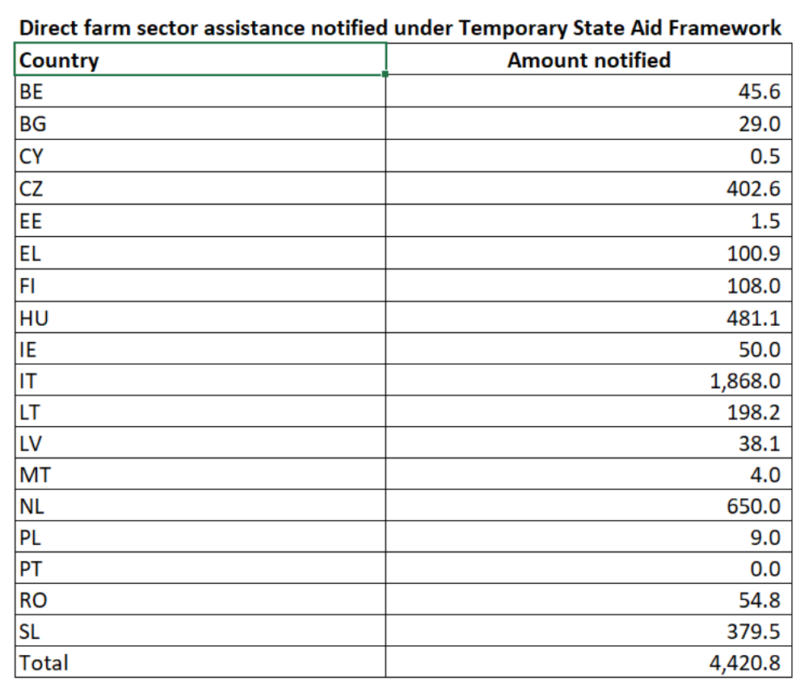
Instead, the EU introduced a Temporary Framework for State Aid that allowed Member States to provide additional assistance to, among others, their agricultural and food processing sectors. The EU has notified those schemes that had a specific agricultural focus to the WTO Committee on Agriculture. The following table, drawn from these notifications, indicates that Member States planned to allocate over €4.4 billion to their agricultural and food processing sectors. This is certainly an underestimate. Large countries such as France, Germany and Spain are omitted from this table, most likely because the farm assistance provided in these countries was included under an umbrella assistance scheme for all sectors and the share allocated to farmers is indeterminate. Nonetheless, Member States sought permission to provide at least €4.4 billion in support to agriculture in response to the pandemic.
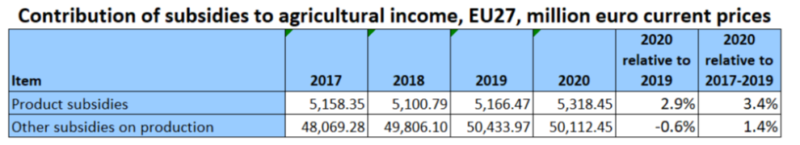
The puzzling fact is that this additional assistance does not show up in the subsidy elements of the 2020 economic accounts for agriculture. Subsidies are included either as product subsidies (coupled to specific commodities) or as other subsidies on production (including direct payments and area-based payments in rural development programmes). According to the accounts, there was a small increase in product subsidies (of around €150 million) but no significant change in other subsidies on production.
There could be several explanations. One is that Member States have made commitments to farmers but this money was not paid out in 2020. Another is that the assistance notified under the Temporary State Aid Framework can be a mixture of grants and loans. The loan elements would not necessarily show up as a subsidy transfer to farmer (interest rate subsidies on subsidised loans are not separately notified in the accounts, but the very small fall in interest paid shown in the table above does not seem to reflect any major impact from this source). I find it overall puzzling why subsidy payments to farmers in 2020 have remained unchanged despite the huge assistance packages, it would be helpful if anyone is able to throw further light on this.
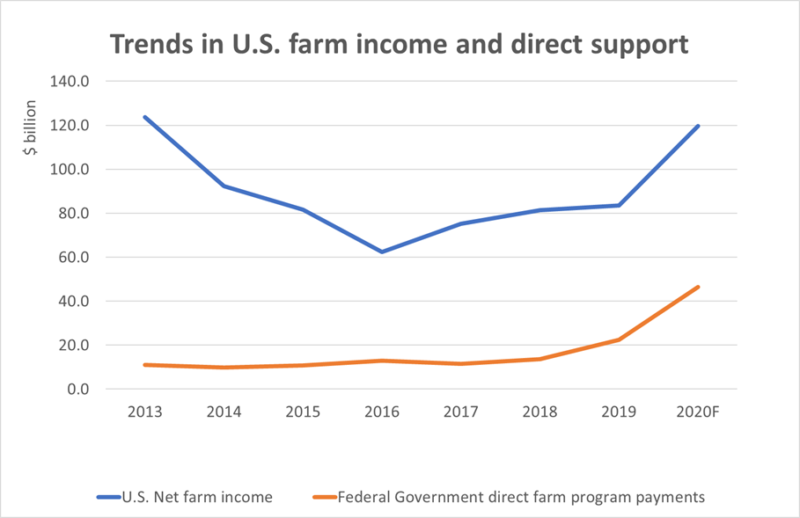
This is in dramatic contrast to the U.S. where one-off COVID-related payments to farmers have pushed U.S. farm income to a near-term high. The value of agricultural output in the U.S. in 2020 is expected to decline only slightly relative to 2019 by 0.9%. But net farm income is forecast to increase $36.0 billion (43.1%) to $119.6 billion in 2020. This is largely due to an increase in direct Government farm payments to $46.5 billion in 2020, an increase of $24.0 billion in nominal terms (107.1%) because of supplemental and ad hoc disaster assistance for COVID-19 relief.
Conclusions
In the very early days of the COVID-19 pandemic there were justified fears that the lockdowns and associated restrictions could have very negative impacts on EU agriculture and the food industry. Thanks to extraordinary effects by farmers, the food system, regulators and the Commission, these dire predictions did not come to pass. The end-of-year accounts just published by Eurostat, while documenting a significant fall in family farm income compared to 2019, also highlight how resilient the farm sector has been.
The big puzzle in these figures is that the significant increase in Member State assistance to their agricultural sectors does not show up in the figures. It would be really good to get a clear explanation why this is not the case.
This post was written by Alan Matthews
Photo credit: bogitw on pixabay, used courtesy of a Creative Commons licence.

Thank you Alan for this interesting post. Your general conclusion that the agricultural sector was hit less hard than expected and quite resilient, can be confirmed for the Netherlands. At Wageningen Economic Research we have kept a close watch on developments in the Dutch agrosector, and indeed, a number of sectors was hit particularly hard (like the potato and veal sector), others have shown a remarkable recovery. Overall, the Dutch farm incomes in 2020 are lower than in 2019. Differences within subsectors and between farms are however substantial, depending on for instance whether the entrepreneurs produces for the home or out-of-home market. And COVID does play a role, but the African swine fever and other factors as well. It is not always possible to distinguish between these factors to decide what ultimately caused the drop in prices or output.
Regarding your question on where the subsidies have gone, I know for a fact that in the Dutch accounting system, subsidies are included under general revenu, similar to for instance direct payments of the CAP.
Regards,
Petra
@Petra
Thanks for the informative comment. Indeed, I was aware of the danger of looking at the ‘net’ outcome for output value and income and ascribing this to COVID-19 when there will be many influences pulling in different directions and very difficult to disentangle. I checked the Dutch figure for subsidies and indeed there is a substantial increase in ‘other subsidies on production’ shown for 2020. This suggests another possible explanation for the ‘missing’ assistance in the Eurostat figures, namely, that ‘other subsidies on production’ would have fallen in 2020 (it was the first year of direct payments under the new MFF ceilings) if it had not been for the COVID assistance.
THE NETHERLANDS 2017 2018 2019 2020
ENTREPRENEURIAL INCOME 4,095.25 2,969.09 3,260.97 2,756.43
OTHER SUBSIDIES ON PRODUCTION 885.62 955.33 1,014.95 1,372.35
SUBSIDIES ON PRODUCTS 120.00 111.10 104.01 104.01
infomediaries