
Overall inflation in the EU shows some tentative signs of moderating in the latest figures for the Harmonised Index of Consumer Prices (HICP) from Eurostat for February 2023. From a peak annual rate of inflation of 11.5% in October 2022, the annual rate fell to 9.9% in February 2023. This is entirely due to a fall in energy costs which also reached their peak in October 2022. Food price inflation, however, continues unabated and increased further in February 2023 to an unheard-of annual rate in recent decades of 19.1%. Unfortunately, this high rate of food price inflation looks set to continue for a further period.
Food price inflation in context
Food prices in the EU have risen dramatically in recent years (in this blog post, food prices include non-alcoholic beverages but exclude alcoholic beverages whose prices have risen at a slightly slower rate). In the EU as a whole food prices were 38% higher in February 2023 relative to the price level in 2015, while the overall price level rose by just 24% during this period. The chain of disruptions caused by the COVID-19 pandemic, extreme weather events, animal disease outbreaks, tight global markets and the Russian invasion of Ukraine in 2022 have all contributed to higher consumer food prices.
It is not only food prices that have been increasing. Energy prices have also soared, while higher interest rates associated with the end of the easy money policy mean that rents and mortgages are also rising. As a result, purse strings are being tightened even more to make ends meet. Many low-income households are facing real difficulties in managing household budgets as a result.
The first diagram below shows food price inflation relative to the other main components in the consumer price index, non-energy industrial goods, energy and services. The left hand panel shows the trend in prices for each of these components as well as the overall HICP. In the right hand panel, the price trends for each of the four components are shown relative to the trend in the all goods HICP.
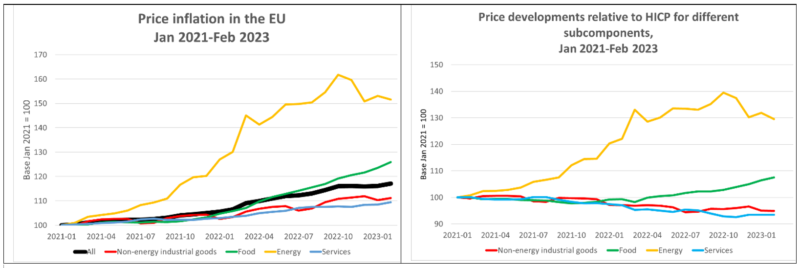
The dynamics of inflation emerge clearly from these charts. After January 2021 inflation was driven by rising energy prices. Non-energy industrial goods and services helped to moderate the overall rate of inflation, while food prices increased in line with inflation up to early 2022. After March 2022 energy prices continued to rise while food price increases also led general inflation, while non-energy industrial goods and services continued to moderate the overall increase in prices. Since October 2022 however, energy prices have been falling as have prices of non-energy industrial goods, while prices of services but particularly food have been the leading inflationary pressures.
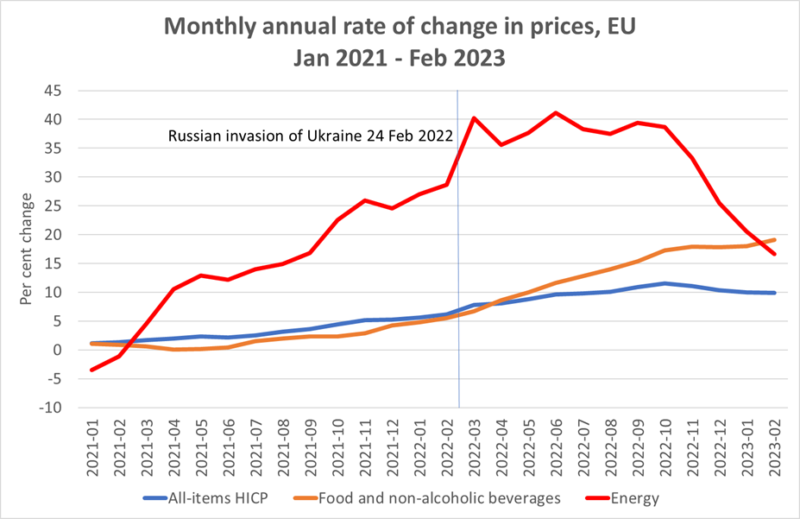
These dynamics are further illustrated by examining the monthly annual rate of change in inflation, shown in the following chart. Here we also see that food price inflation rose broadly in line with general inflation until the Russian invasion of Ukraine on 24 February 2022, after which the monthly food price inflation figures have all exceeded the overall inflation rate. The divergence since October 2022 when the overall rate of inflation began to fall while food price inflation gathered pace emerges clearly.
Food price inflation varies by food item
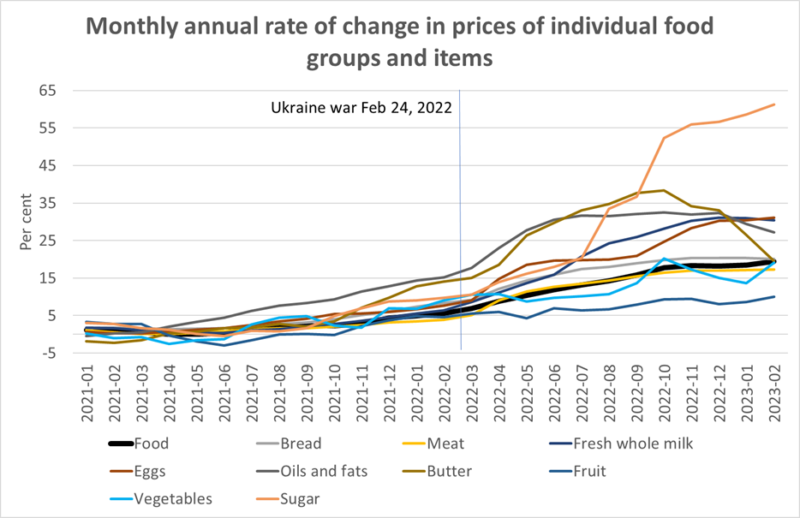
The war in Ukraine increased global prices for various commodities, but notably wheat and vegetable oils. The next chart shows the trend in prices for some specific food items. The increases in prices of oils and fats and butter (whose prices are closely linked) and in bread immediately after the Russian invasion is very clear. However, prices of eggs, fresh milk and particularly sugar also contributed disproportionately to the overall food price inflation. On the other hand, prices of meat and vegetables rose but not by more than food prices generally, while prices of fruit moderated the overall increase. More recently, butter prices have fallen though they are still a bit above the level they were at prior to the Ukraine war, while oils and fats prices have stabilized. The recent advance in food prices appears to be driven largely by the increases in egg prices but particularly sugar, but it should be noted that the graph only includes a small sub-set of the food items that make up the consumer price index.
Geographical differences across Europe
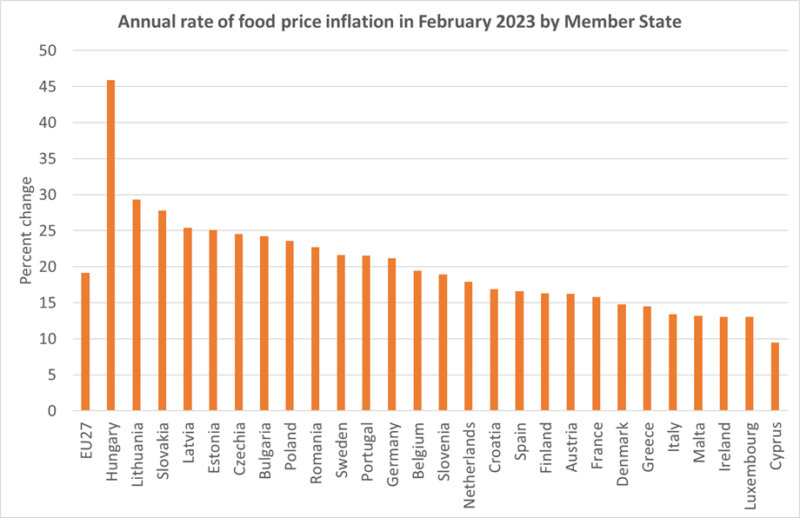
What is particularly striking is the uneven impact of food price inflation across EU Member States. The following chart shows that food price inflation has been higher in the Central European countries relative to the rest of the EU, with Hungary being an outstanding outlier. In February 2023 food price inflation in Hungary reached 46% on an annual basis, well ahead of the EU average of 19%. Of the new EU Member States, only Slovenia, Croatia and Cyprus had a lower rate of food price inflation than the EU average in February 2023.
Higher rates of food price inflation in Central European countries are even more significant because the populations in these countries spend more on food as a percentage of overall household expenditure than they do in Western Europe.
Future prospects for food price inflation
With energy prices falling and overall inflation beginning to ease, and with the European Central Bank raising interest rates in the euro area, it might be expected that food price inflation has also peaked. But this may be wishful thinking rather than a qualified projection. The main reason for expecting food prices to continue to increase is the existence of lags in adjusting to price changes along the food chain.
Eurostat has developed a food prices monitoring tool which on a monthly basis allows to follow price developments at different stages of the food chain. The next chart shows price developments at the primary producer or farm level (agricultural producer price index), the processor or wholesale level (producer price level) and at the consumer or retail level (HICP Food).
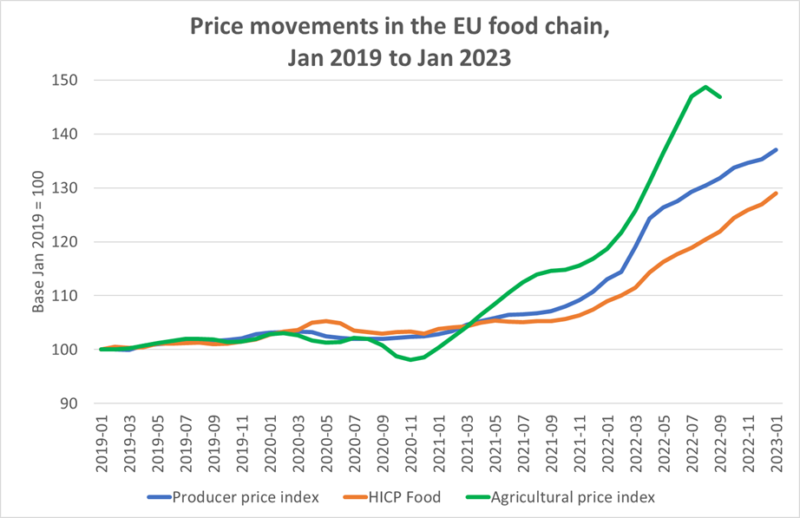
Prices have increased most at the farm level and least at the retail level. But it is also clear from the chart that the price transmission process takes time. Farm prices were increasing for several months before this was reflected in the prices of processing firms, and in turn their prices began to increase several months before this was reflected in retail prices. The implication is that firms at the downstream end of the food chain take time to adjust prices to increased input costs, either because they are locked into fixed price contracts, or because they are uncertain initially about the extent to which they can pass the higher costs on in the form of higher prices due to competitive pressures. As contracts are renewed and firms become more confident in their ability to recoup their higher costs from downstream actors including consumers, we see downstream prices also begin to increase but with a lag.
The latest monthly data from Eurostat for agricultural producer prices is only for October 2022 and shows a small dip in farm level prices. However, even if this trend continues into the early months of 2023, we are unlikely to see this reflected in processor and particularly retail prices for several months more given the existence of this lag in price transmission.
Readers will be aware that global food prices have been falling now for eleven consecutive months, as shown in the final chart. Also here, there is evidence that the transmission to EU farm prices also takes place with a lag. Reweighting the FAO food price sub-indices to reflect the composition of EU production shows that EU farm prices only reacted after several months to the increase in global prices, and there has been a similar delay in responding to the fall in global prices. However, it now appears that EU farm prices have also peaked, and we can expect further falls in the coming months in line with the fall in global prices that has already occurred. But as argued above, a fall in EU farm prices will not be reflected immediately in a reduction in food price inflation in the EU because of these lags in price transmission.
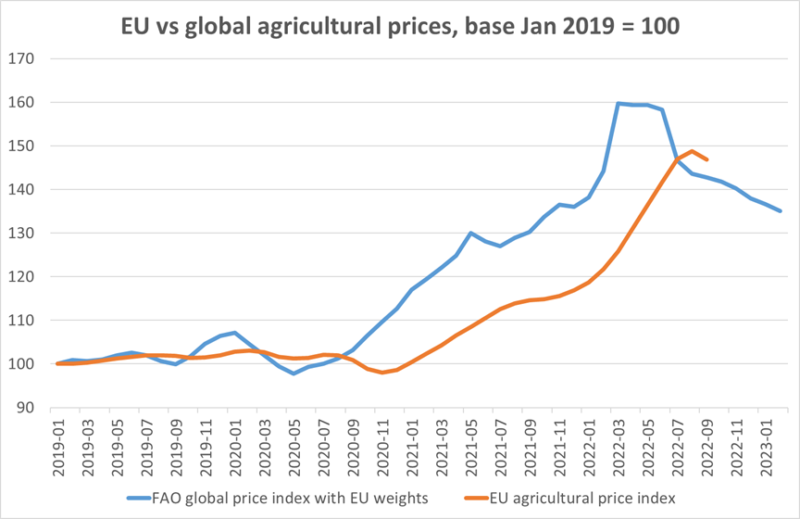
Source: FAO Global Food Price Index; EU agricultural producer price index from Eurostat, Food Prices Monitoring Tool PRC_FSC_IDX
Conclusion
Food price inflation reached 19.1% in the EU in February 2023. This is the highest level ever recorded in the Eurostat HICP database going back to January 2020. Even higher rates of food price inflation are recorded in Central and Eastern Europe, with Hungary a particular outlier with food price inflation of 46% in February 2023. The populations in these countries are doubly hit because their share of expenditure on food in household budgets is also higher than in the countries of Western Europe.
While there are signs that overall inflation is beginning to fall, food price inflation has been increasing in recent months. This is despite the fact that global prices have been falling now for almost a year.
While there can be EU-specific explanations in particular cases (the severe outbreaks of avian flu have contributed to rising egg prices), the explanation for the continuing rise in food price inflation is mostly likely down to the lags in transmitting price changes through the food price chain. Food price increases in the past year, though very high, have not fully reflected the increases in prices at primary producer level. As food manufacturers and retailers continue to adjust their prices to these higher input costs, food price inflation is likely to continue at a high level.
This post was written by Alan Matthews.
Photo credit: Jernej Furman and used under a Creative Commons CC by 2.0 licence
