How serious is the current dairy market situation? Are prices really below costs of production? In this post, I examine recent dairy market trends to throw light on these questions. The Agriculture Council meeting tomorrow (see this post for a preview) is expected to agree a package of aid for dairy farmers, but why should this be necessary? The Milk Market Observatory now provides detailed and up-to-date information on milk market trends and I make extensive use of its data and charts in this post.
What is happening to milk prices?
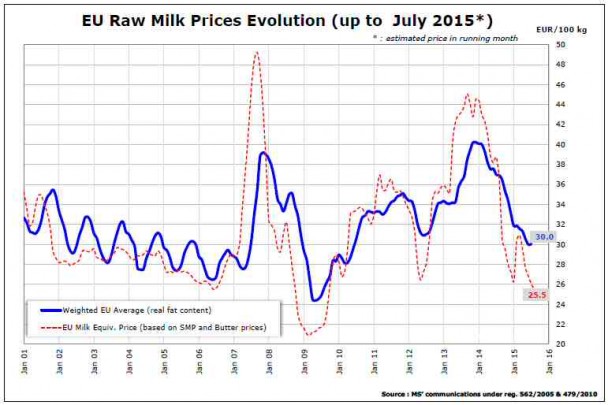
The trend in milk prices shown in the chart above can be divided into two periods: a downward trend in the years to 2007 (driven by the reduction in intervention prices and export subsidies due to CAP reform), and an upward trend since then but with great volatility. The peak price was reached in Nov-Dec 2013 when the weighted EU average milk price reached €40.21/100 kg. Since then it has fallen month on month to an estimated €30.03/100 kg in July 2015 (though the estimated price in July shows a marginal increase on the June price for the first time since Dec 2013).
The actual evolution of prices differs across member states; data from the Milk Market Observatory show that prices in June 2015 were, on average, 20% lower than in June 2014 across the EU, with reductions ranging from 15-16% in Austria and Italy to 28-29% in Latvia and Estonia which have been hardest hit by the Russian ban. These prices are in nominal terms: taking account of inflation would show lower increases and larger decreases in real producer prices over the period.
The dotted red line shows the estimated milk price that would be returned given the prices actually paid for butter and skim milk powder. These are basically commodity dairy products and would normally be the lowest-value uses for milk; milk used for cheeses and fresh produce should normally return a higher price. We see this in the pre-2007 period where, leaving aside the seasonal fluctuations, the producer price normally exceeded the milk equivalent price.
The post-2007 period shows two characteristics. First, the milk equivalent price shows even greater volatility than the producer price, indicating that agents in the dairy supply chain (retailers, processors and purchasers) have acted to smooth out some of the more extreme movements in producer milk prices. But this smoothing action has come at a price, as the traditional ‘premium’ in the producer price over the milk equivalent price has largely disappeared.
The data for mid-2015 show the milk equivalent price well below the producer price at a level of 25.5c/litre. Even if dairy product prices were to recover in the second half of the year, there is little expectation that this will be reflected quickly in an increase in milk producer prices.
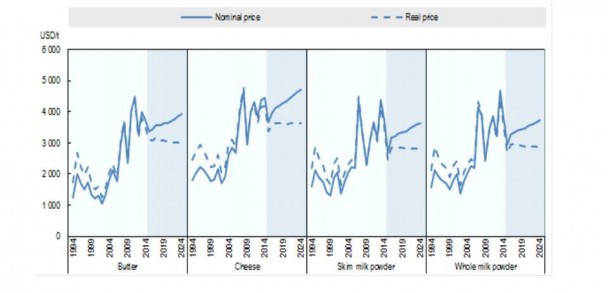
Given the volatility in milk prices since 2007, it is difficult to know what the medium-term equilibrium milk price is. If we expect that the upward trend in milk prices since 2007 will continue, driven by notions of insatiable Chinese demand, then the mid-2015 milk price lies well below trend. If, however, a more sober view of world market developments is taken then the current producer price may not be too far below equilibrium. The most recent OECD-FAO world market price projections for dairy products (in US dollars) suggest some recovery in prices from their 2014 levels over the decade to 2024 in nominal terms but prices remaining stable at the 2014 level in real terms.
Margins are more important than prices
From a farmer’s point of view, the milk price is only part of the story. What ultimately determines trends in dairy farmers’ incomes is the movement in the margin for milk, i.e. the difference between revenues and costs. DG AGRI has developed a milk margin tool based on the latest FADN information on the composition of revenues and costs which is updated using price indices for milk and the relevant inputs, thus giving an up-to-date picture of margin (and thus income) trends. The milk margin is presented in terms of euro per tonne of milk produced, including coupled payments but excluding all decoupled income payments and other payments not linked to production. Both the gross margin (revenues less operating costs) and the net margin (revenues less operating costs less depreciation and payments to external factors) are calculated, but only the gross margin estimates are regularly updated on a quarterly basis.
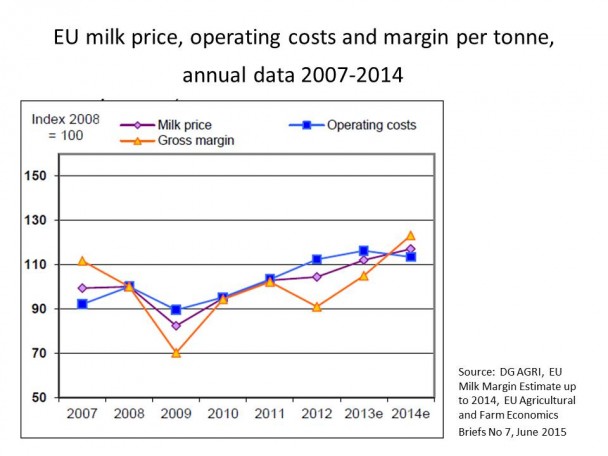
The chart above shows the Commission’s estimates of how the milk gross margin has developed between 2007 and 2014. It brings out clearly the exceptional nature of the year 2014 when the milk margin was at a record high, not only because of high milk prices but also because costs fell slightly in that year. A second point to underline is that the milk margin fluctuates much more than either milk prices or operating costs alone.
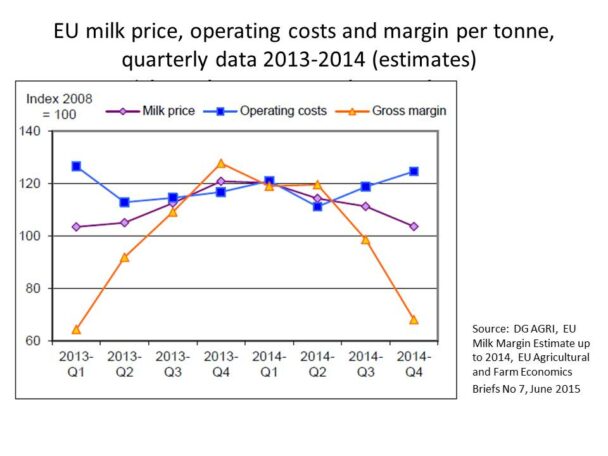
This point is made even clearer if we look at quarterly data for the two years 2013 and 2014 (next chart). Note that neither the milk price nor operating costs varied by more than 20% over these 24 months, yet the milk gross margin varied by a factor of more than 100%. This reflects the fact that dairy farmers are highly geared with relatively narrow margins. Even small changes in either milk prices or unit costs are amplified into much larger changes in margins and income. Margin and income volatility are thus not exceptional events but a fact of life for dairy farmers. The industry has been slow to address this fundamental characteristic of dairy farming and to come up with institutional arrangements to help dairy farmers manage this risk.
With this background in mind, the MMO’s latest analysis of the evolution of milk margins by quarter gives more detail on the trend during 2014 and the first quarter of 2015. Note that the chart below is in index form to base 2008=100, not in absolute amounts. In interpreting indices, it is important that the base year is a reasonably representative year. From this point of view, 2008 seems a good year to choose, as shown in the earlier chart.
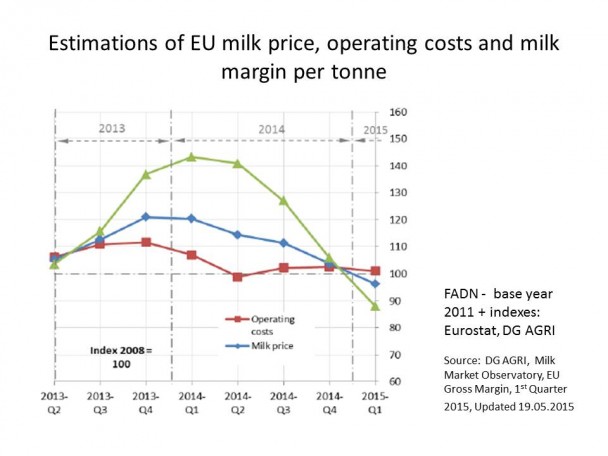
The milk price, operating costs and the milk margin were all in line with the values in the representative year of 2008 in Q1 of 2013 (in nominal terms), i.e. all indices are very close to 100. We then see the 40% increase in the milk margin by Q1 of 2014, and the 50% decrease in this margin by Q1 2015. Given that milk prices have fallen further by Q3 2015 (even if we must wait for the final outcome for the September price) and that (according to Eurostat) feed prices have increased, the milk margin will have fallen further by Q3 2015. Whether it will hit the 70% of the 2008 value which it reached during the 2009 dairy crisis (see earlier chart) is as yet unknown..
There is thus no doubt that the milk market is going through a very difficult period of low prices and low margins, albeit not unprecedented. This follows a period of high milk prices and record milk margins last year. One question prompted by this analysis is what has the industry done to protect itself from these inevitable cycles, particularly during the favourable years of 2013 and 2014?
Averages only tell part of the story
According to the FADN 2011 data, average operating costs including depreciation and payments to external factors for all EU specialist dairy farms amounted to 31c/litre. Operating costs have probably risen by around 10% since then (see EU Agricultural and Farm Economic Brief No. 7), so the average cost of producing a litre of milk across the EU in 2015 is probably around 34c/litre. With an average milk price of 30c/litre, it is clear many farmers are currently producing milk at a loss.
Update 8 Sept 2015. For clarity, we can note that a dairy farmer will continue to produce milk provided that revenue exceeds his or her variable cash costs so that some surplus exists which contributes to overhead costs and the remuneration of family-owned factors: variable cash costs are lower than the operating costs included in the net margin but the MMO does not provide data on just how much lower.
There is uncertainty around this figure because different methods can be used to allocate whole farm costs to the dairy enterprises. Other sources give a lower figure for the average cost of milk production in the EU. Also, the margin calculations do not take account of income from the sale of calves and cull cows, the contribution of other farm enterprises, nor the value of decoupled income payments and other farm payments, so they are only a partial guide to the income position of dairy farms.
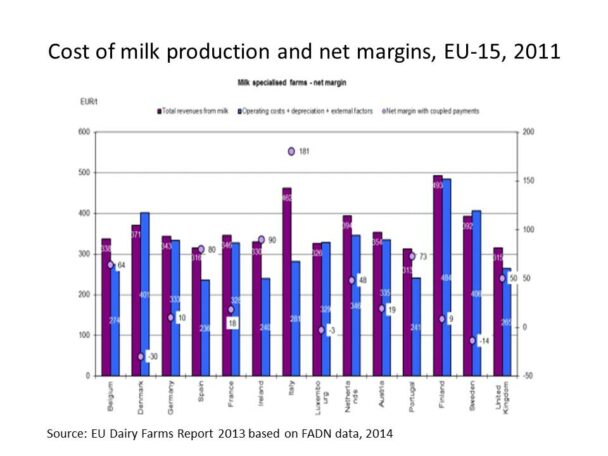
Most important, averages only tell part of the story. Across the EU, milk prices and input costs, and thus margins, differ widely across member states. The chart below makes this point using 2011 data for the EU-15 member states. Costs per tonne of milk produced vary from a low of €240/t in Ireland to €400/t in Denmark; in Germany and France, which together account for 40% of EU milk production, costs in 2011 were around €330/t. Revenues per tonne also vary across countries, being highest in the Nordic countries and Italy.
Thus it is not surprising to see significant variation also in the net margin figures (the numbers in the small white boxes in the chart). Italy, Ireland, Spain and Portugal head the league with net margins of €181/t, €90/t, €80/t and €73/t, respectively. At the bottom of the league, both Denmark and Sweden had negative net margins, even in an average year for dairying. These figures underline that, even within the EU-15, producers can be profitable at very different price levels; with the elimination of quotas we will expect to see some relocation of milk production from high-cost to low-cost regions.
Perhaps more relevant is to examine differences across individual dairy farms, as is done in the next chart which focuses again on dairy farms in the EU-15. This shows, for various years, the gross margins for farms at six different points in the distribution, the 5% top-performing farms (PC95), the top-performing quarter of farms (Q3), the average and the median, the lower-performing quartile of farms (Q1) and the 5% least-performing farms (PC5).
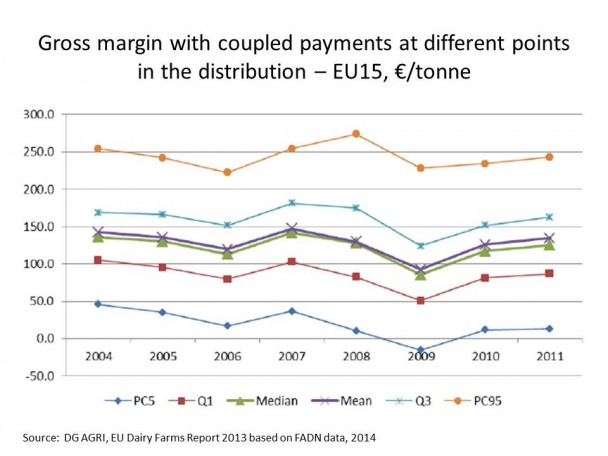
Taking 2008 as an example when the average gross margin was around €130/t, 25% of farms had a gross margin greater than Q3 or €175/t, while another 25% of farms in the lower quartile had a gross margin of less than about €90/t. The difference here is equivalent to more than 8c/litre. It is these latter farms which, either because of higher costs or because they are getting a poor return for their milk, are the most vulnerable in the current downturn.
As there are great differences in costs of milk production across the EU, it hardly makes sense to talk about ‘a’ cost to produce a litre of milk. Also, low prices and low margins this year follow a year of record high prices and margins in 2014. It is clear, nonetheless, that many dairy farmers are now producing below the costs of production. This volatility is a challenge for the dairy industry which so far it has been slow to address.
This post was written by Alan Matthews.
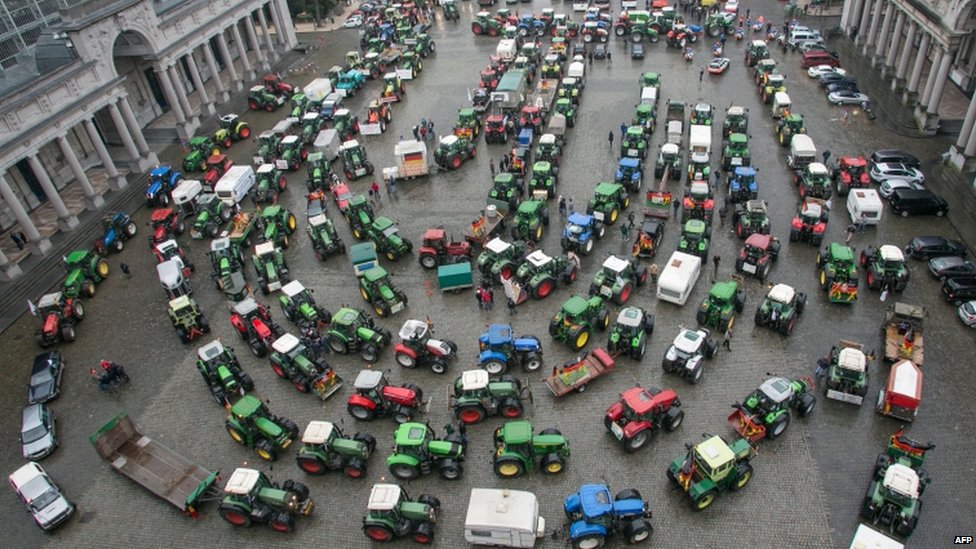
Picture credit: BBC. Tractor protest in Brussels Nov 27 2012

Europe's common agricultural policy is broken – let's fix it!
