Today the OECD published its annual update of trends in producer and consumer support to farmers (measured as the Producer Support Estimate, PSE and the Consumer Support Estimate, CSE, respectively). It shows overall support levels rising in 2012, following the historical low recorded in 2011.
For the OECD countries the share of support in farm receipts is 19%, up from 18% the previous year. There are sharp divergences behind these figures with the highest support countries recording increases (Japan 56%, Korea 54%, Norway 63% and Switzerland 57%) while relatively low support countries fell further (Israel 11%, Mexico 12%, United States 7%). The EU mirrors the overall OECD trend with a rise from 18% to 19%.
Some emerging economies which are key players in agriculture continued to increase support to their farmers – for China, the share of support in producer receipts is now 17%, for Indonesia 21% and for Kazakhstan 15%. In others, such as Brazil 5% and South Africa 3%, producer support remained at low levels.
The longer term trend in the OECD countries is towards measures delinked from production even if better targeting to explicit goals such as environment has been slow to develop. The emerging economies where support is rising tend to resort mainly to border protection and market price support, effectively taxing consumers.
Producer support in the EU
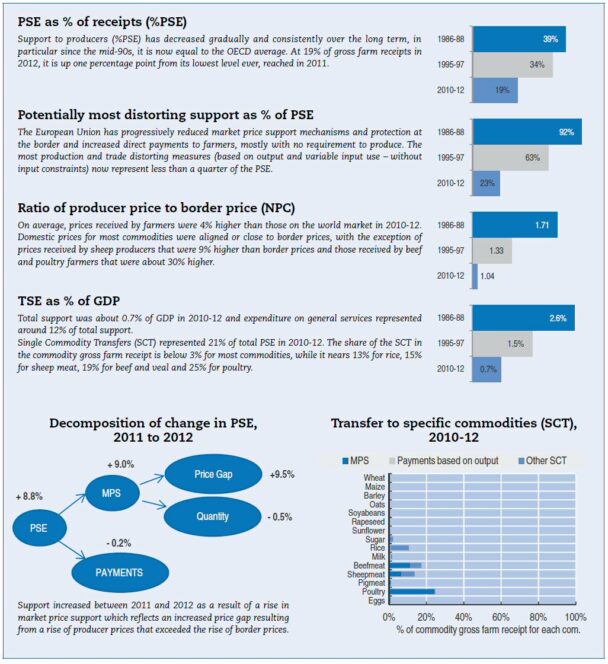
The report includes a chapter on the EU which includes the summary figure below showing longer term trends in producer support. Substantial progress has been made in reducing the level of support and the share of production and trade distorting support in the EU.

The report notes that producer support to EU farmers rose by 8.8% last year. The combination of EU, national and regional payments to producers represents over 80% of the PSE. Those payments were relatively stable between 2011 and 2012 (-0.2%). The 9% increase in the PSE in 2012 was due to the rise in market price support, explained by a rise in producer prices that was higher than the rise in world prices.
In fact, the value of market price support in the EU increased last year from €9.7 billion in 2011 to €16.6 billion in 2012, reflecting an increase in the average rate of protection from 3% to 5%. This increase is a consequence of existing policy instruments that isolate producers in some sectors from world prices, rather than of a change in policies.
On average, prices received by EU farmers were 4% higher than those on the world market in 2010-12. Domestic prices for most commodities were aligned or close to border prices, with the exception of prices received by sheep producers that were 9% higher than border prices and those received by beef and poultry farmers that were about 30% higher. The percentage support provided to poultry producers will be a surprise to many, given the highly industrialised nature of that sector.
In 2012 the share of payments with no requirement to produce slightly declined as EU member states used the flexibility to grant payments requiring specific production or specific types of farming (Article 68). Although these payments are limited to 10% of the overall envelope, the report notes they may distort competition across EU member states.
Looking ahead, the OECD notes that Transitional Complementary National Direct Payments will be maintained in 2013 despite the end of the transition period for new member states. This opens the possibility to exceed the ceiling defined for 2013 and may distort competition in cases where payments are linked to specific commodities.
This post was written by Alan Matthews
Photo credit: © Copyright Will Lovell via Geograph and licensed for reuse under a Creative Commons Licence.


