Update 15 December 2012: I have now learned that I was incorrect to attribute the table of allocation of rural development funds to Van Rompuy in this post and these figures were not circulated at the European Council meeting as I suggest. I regret the error but I have left the post stand unedited as an example of one possible distribution of funds being discussed in the negotiations. But as of this date no official proposed allocation has been made, see fuller discussion here)
In previous posts I had wondered how member states were expected to come to an agreement on the MFF for the 2014-2020 period at the special European Council meeting at the end of the November without being aware of the proposed allocation of Pillar 2 rural development funds under the CAP. The answer is now clear. A well-kept secret is that Herman van Rompuy (HvR) did circulate proposed rural development allocations at that meeting. In this post I present these figures and discuss some of the implications.
The Van Rompuy rural development allocations
According to the draft Council conclusions in HvR-II, the figures are based on objective criteria and past performance as well as specific allocations of €2,370 million to five member states (Austria (€700m), Italy (€1,000m), Luxembourg (€20m), Slovenia (€150m) and Finland (€500m). The resulting allocation is shown in the table, and compared to the 2007-14 allocations both expressed in 2011 prices.
The table shows significant differences in the proposed percentage changes in rural development spending by member state, ranging from a drop of 29% for Malta to an increase of 5% for Denmark (for comparison, the average reduction in the HvR draft II of the MFF for Pillar 2 spending is -14%).
The fact that there are significant shifts in rural development funding between member states is, in itself, not a surprise. Some redistribution should be expected, as current national allocations are largely determined by past payment patterns. For example, for the EU15 member states the original distribution key goes back to Commission Decision 1999/659/EC setting out allocations for the 2000-2006 MFF and which in turn was based on rural development spending pre-2000.
Basis for the Van Rompuy allocations
According to the HvR draft conclusions, apart from the specific allocations the distribution key is based both on historic allocations and objective criteria. The weights to these two criteria and the objective criteria used are not specifically indicated, but some indications can be gleaned from the distribution keys discussed in the Commission’s impact assessment of its rural development proposals.
The most relevant comparison is with the proposed distribution key using objective criteria for the Commission’s favoured integration scenario in the impact assessment. The objective criteria for the distribution of support were:
- In relation to Objective 1 (competitiveness of the agricultural sector), agricultural area and labour force are used as indicators of the economic size of the agricultural sector and labour productivity of the extent to which the sector is lagging behind;
- In relation to Objective 2 (climate change and the environment), agricultural area, Natura 2000, NHA, forest and permanent pasture areas are used as indicators of the public goods provided.
- In relation to Objective 3 (balanced territorial development), rural population is used as an indicator of the target group benefiting from the support while the extent to which rural areas are lagging behind is covered by the use of a GDP coefficient for the whole formula.
For cohesion purposes, the whole formula is then calibrated by GDP/capita in PPS (the lower the GDP in the MS, the higher the MS envelope).
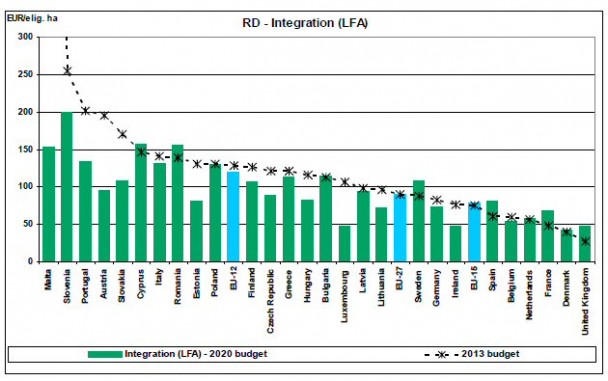
The resulting allocation of support in 2020 compared to 2013 if objective criteria alone were used is shown in the following diagram expressed in terms of payments per eligible hectare. Big losers would be countries to the left of the chart, including Malta, Portugal, Austria, Slovakia and Estonia, as well as Luxembourg and Ireland.

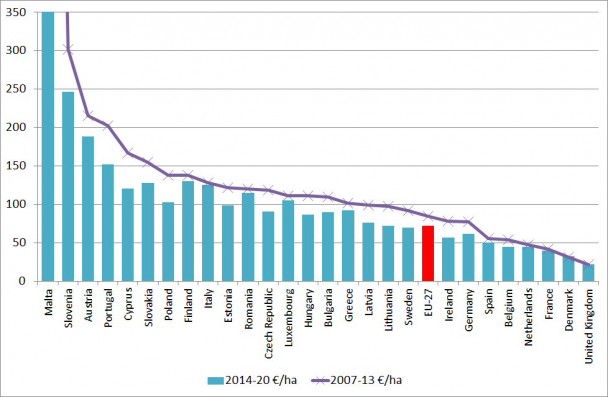
The allocation suggested by HvR, adjusted to a similar per hectare basis, is compared to the current distribution in the diagram below. (The ordering of countries by current payments per ha is slightly different to that in the previous diagram from the Commission’s impact assessment. This could be due either to the fact that the diagram below uses the average 2007-13 payment and not just the 2013 year alone for the base period data, or because I have used slightly different figures for the potentially eligible area in each country, but the differences are not significant).

Now the big losers are Malta, Cyprus, Ireland, Lithuania, Poland, Portugal, Sweden, Latvia, Czech Republic and Hungary (these are all the countries with reductions of 20% or more – in addition, Estonia, Slovenia, Bulgaria and Slovakia all experience larger than average reductions). Rural development spending in the UK would also be significantly reduced even if this is not clear from the figure unless the UK made use of the proposed flexibility mechanism to transfer funds from Pillar 1 to Pillar 2. This is because the UK now uses voluntary modulation to increase its Pillar 2 spending at the expense of Pillar 1 to a very significant extent (approximately €4.6 billion in 2007-13 compared to €2.4 billion used by the Commission in these calculations).
What is striking is the preponderance of new member states in the list of member states with above-average reductions in their rural development allocations. It appears, whether engineered or not, that the gains these countries expect from the convergence of direct payments in Pillar 1 will be offset by disproportionate reductions in their expected receipts in Pillar 2.
Are the outliers justified by objective criteria?
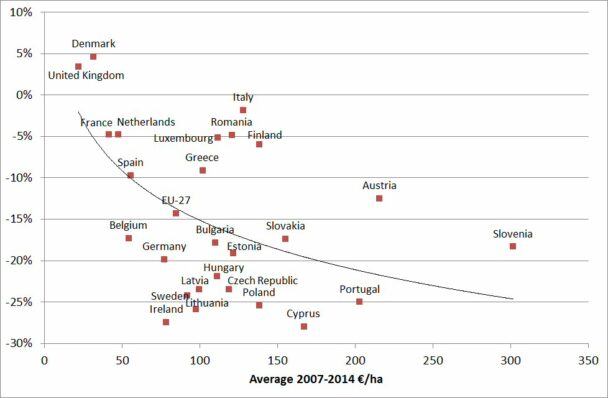
Some further light on the allocation criteria is gleaned from the final chart, which shows the relationship between the size of the proposed change in rural development allocations and the initial level of the allocation. There is a clear negative relationship, indicating that those countries doing well in the current period are likely to suffer a disproportionate reduction in the next (note that Malta is omitted to make the graph easier to read because its current payment of RD funds per ha is so high).

Equally interesting are the outliers, those countries furthest from the trend line (drawn here as a logarithmic curve). Ireland is shown to face a disproportionate reduction relative to a baseline based solely on a criterion where those countries with the largest current payments per ha are expected to make the largest reductions. Conversely, Austria appears to escape relatively lightly relative to this criterion.
It could be that, relative to an alternative baseline based solely on objective indicators, these relative reductions are justified. However, inspection of the graph from the Commission’s impact assessment shows that, based on objective indicators alone, Austria should face a reduction equally as large as Ireland. The fact that it does not under the HvR proposal suggests that other factors are also playing a role. The puzzling special allocations to the five countries which are not otherwise explained adds to the perception that political bargaining has influenced the final outcome.
If indeed the allocation of Pillar 2 funds has been massaged for political reasons, expect to see a strong political kick-back from the new member states which disproportionately lose out under the HvR proposal.


@Alan
I have only a very short comment. You accepted the term ‘objective criteria’. I suggest that the selection of the criteria are far from being ‘objective’. Are these criteria an indicator of the expected return to the financial resources used? I think not. Is the allocation in line with the principle of subsidiarity? I think not!
The term ‘objective’ seems to indicate that the allocation of funds is based on some rational criteria, but it is not.
@ Ulrich
Thank you for this comment . It is the case that the choice of so-called objective criteria is itself a very political exercise, as there are in principle a variety of indicators which could be used as the basis for the allocation of funds all of which give different outcomes, so member states have an incentive to favour the criteria on which they do best. But your point is a different one, and also valid, namely, that the criteria used are not chosen or guided by principles of rational decision-making or intent to get best value from the expenditure across the EU as a whole.
At some very high level, there probably is some linkage. For example, I suppose we would expect better results from allocating funds on the basis of the UAA of each MS than on the basis of population. But this is a very crude linkage and, I agree, not likely to improve efficiency of expenditure very much. I agree that using statistical indicators (which is what is meant by ‘objective critera’) to allocate RD funding is very different to saying that the funds are being spent wisely or well.