Economic sustainability is usually taken to be one of the three legs of the sustainability concept (the others being environmental and social sustainability – hence the phrase ‘people, planet, profit’). But what do we know about the economic sustainability of EU farming and how to measure it? A recent paper by researchers (Cathal O’Donoghue, Simon Devisme, Mary Ryan, Ricky Conneely, Patrick Gillespie and Hans Vrolijk) participating in the FLINT project have now used a pilot dataset collected at farm level in 8 Member States to focus attention on this issue.
The FLINT (Farm Level Indicators for New Topics) research project investigates the feasibility of providing policy-makers and the agro-food industry with farm-level indicators on sustainability and other relevant new issues. The project established a pilot network of around 1100 farms already participating in the FADN network in nine Member States to investigate the feasibility of collecting these indicators. Having demonstrated the feasibility of collecting a set of relevant indicators on these pilot farms, the project is recommending that the FADN sample should be reduced from 85.000 to 75.000 farms to have capacity for sustainability data on 15.000 farms.
Farm viability, another term for economic sustainability, is measured in terms of the achievement of a specific income objective:
 where family farm income (entrepreneurial income) is defined as total output less intermediate consumption less deprecation less payments to external factors plus balance of subsidies less taxes. While family farm income (FFI) and the hours worked on the farm are data collected in the FADN survey, the cost of own capital is an imputed estimate and the threshold wage, or income target, is also a subjective decision.
The researchers use three different binary criteria to develop 8 (2 x 2 x 2) different farm viability models:
• either the cost of capital is included (defined as a fixed percentage of all own assets based on long-term European Central Bank interest rates) or it is not. Excluding the cost of capital shows a higher proportion of viable farms;
• the threshold wage is set either at the average wage of full-time employees in the total economy (average (industrial) wage) or at the average wage in agriculture. Using the average wage in agriculture shows a higher proportion of viable farms;
• based either on an opportunity cost or fam level approach. In the opportunity cost approach, FFI is calculated per hour of labour actually reported and compared to an hourly wage. In the farm level approach, the farm income is calculated per Family Work Unit (FWU) and compared to the average annual wage. One FWU is equal to a family Agricultural Working Unit (AWU) equivalent to one person working full-time on the holding. For unpaid family labour, it is well known that the hours worked tend to be overestimated in the FADN return. In converting to AWUs, however, a single person cannot exceed 1 AWU equivalent, even if his or her actual working time exceeds the norm for the region and type of holding. It follows that the reported FFI per hour worked by family (unpaid) members will tend to be lower than that reported per FWU. Alternatively, as the authors of the paper argue, farms which are not viable on a per hour basis may be viable on an FWU basis because of the high numbers of hours worked. A high labour input may allow a farm to achieve viability, even when it is not viable when examined on a per hour basis.
Three viability classifications are used: viable, sustainable and vulnerable farms. A farm is classified as viable if the FFI per labour input is greater than a threshold wage. Farms are economically sustainable if they are not viable but either the farmer or the spouse has off-farm employment. Finally, vulnerable farms are neither viable nor sustainable. They do not produce enough profit to be viable and there is no other income.
The FADN and FLINT data relate to accountancy year 2015, except for France and Germany for which it is 2014. The data for this paper are drawn from around 1,000 observations, so caution is needed in drawing strong conclusions from a relatively small sample.
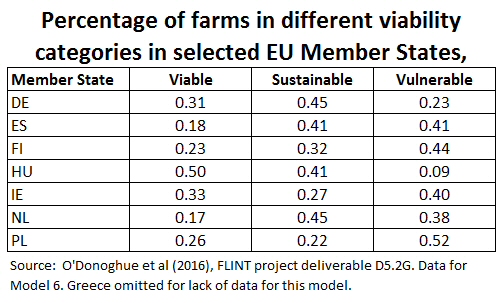
In the paper itself, the percentages of farms viable, sustainable and vulnerable are shown for each of the 8 combinations of the three criteria. To simplify the presentation, I present below a summary of the principal results for Model 6 in the paper, which is based on the following assumptions:
• Farm family income is calculated per Family Work Unit (rather than per hour)
• A deduction is made for the imputed cost of the farmer’s own capital (rather than ignoring it)
• The threshold wage for viability is the average annual wage paid to hired agricultural workers (rather than the average annual economy-wide or industrial wage). This is preferred because of the age and educational level of the family farm workforce.

Viability rates vary across countries but are not necessarily related to high family farm income (FFI). Countries with a high FFI may have a lower rate of viability because the threshold of annual average paid farm labour earnings is relatively higher. Thus, Poland has a larger number of viable farms than the Netherlands, not because it has higher family farm incomes, but because it has a lower opportunity cost of labour. The high viability rate in Hungary is partially due to the nature of the sample which contains a larger share of large cooperative farms. The relatively high proportion of viable farms in Germany on an FWU basis contrasts with a much lower proportion on a per hour basis, indicating that viability in Germany is often achieved on the basis of high labour input.
Differences in sustainability rates across countries reflect differences in the amount of off-farm employment of farmers and their spouses. Note that some viable farms may also have off-farm employment, so the proportions in the ‘Sustainable’ column should not be taken to represent the proportion of farms with off-farm employment in the FADN sample. In fact, more than 40% of all FADN farms have off-farm employment in all countries with the exception of Poland where it is closer to one-quarter. Note that the FLINT dataset does not collection information on the amount of off-farm employment income, only on whether the farmer and/or spouse is employed off the farm.
Finally, the proportion of vulnerable farms is derived as the complementary proportion of the previous results. Hungary stands out with a very low proportion of vulnerable farms, followed at a distance by Germany. For the remaining countries, around 40% of holdings are classified as vulnerable, with the figure for Poland exceeding 50%.
It should again be underlined that these proportions are derived from one particular model defining the three categories. Figures are presented in the paper for eight models in all and, although there are strong regularities across the models, there are also reversals in the rankings and relative importance of the three classes.
The results are also dependent on the way in which the individual variables are defined. The definition of the cost of capital in the paper, for example, although plausible, is different to that used by DG AGRI in reporting on the economic performance of farms in the annual FADN farm economic overview (see the latest 2013 edition here). The cost of capital also ignores changing asset values and wealth which are not taken into account.
Finally, the results are derived from a pilot survey of 1,000 farm holdings which is a very small sample, so one should be cautious about drawing conclusions for the EU farm population as a whole.
Nonetheless, it seems plausible to suggest that, for the 5 million commercial farms which are represented in the FADN database, around one-third are economically viable, one-third are economically sustainable because of off-farm employment income, and one-third are economically vulnerable. This indicates the potential for further significant structural change in the sector in the years ahead.
This post was written by Alan Matthews
Photo credit: Small farm in Croxton, UK, © Copyright Mick Malpass and licensed for reuse under a Creative Commons Licence.

Europe's common agricultural policy is broken – let's fix it!

