Commissioner-designate Phil Hogan committed himself to a growth, jobs and investment agenda for agriculture in his confirmation hearing with the EP’s COMAGRI. Given the stuttering EU recovery and continued high unemployment in EU countries, this is an understandable objective. But can EU agriculture rise to the challenge? Not on its past record, at least without substantially changing the policy paradigm.
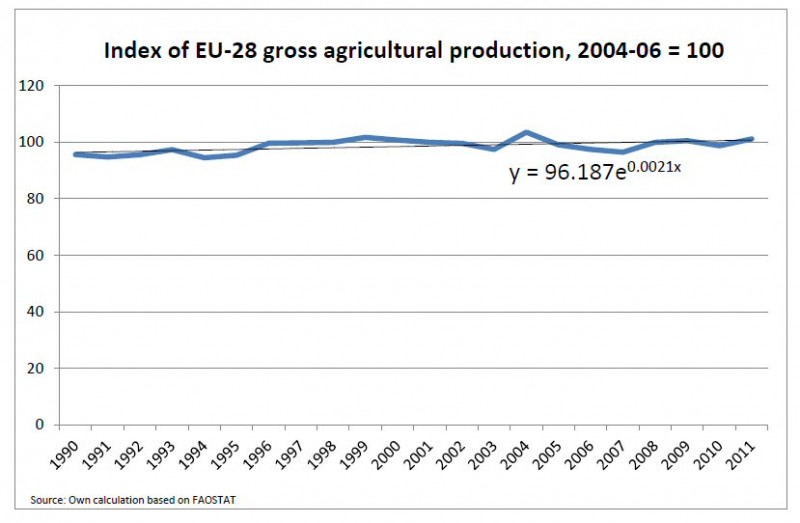
It is rarely recognised just how disappointing the growth performance of EU agriculture has been over the past two decades. As shown in the figure below, the average growth rate over the period 1990-2011 for the EU-28 has been a mere 0.2% per annum. That is, over the 21-year period, the volume of agricultural output in the countries that make up the EU today grew by just 4.5%.

These data are calculated using FAOSTAT data; the data from Eurostat tell a somewhat more optimistic story with a growth rate (for the EU-15) of 0.8% p.a. over a similar period, or a cumulative growth over 21 years of 19% (the differences between the two sources of data are briefly explained in the Technical Note at the bottom of this post).
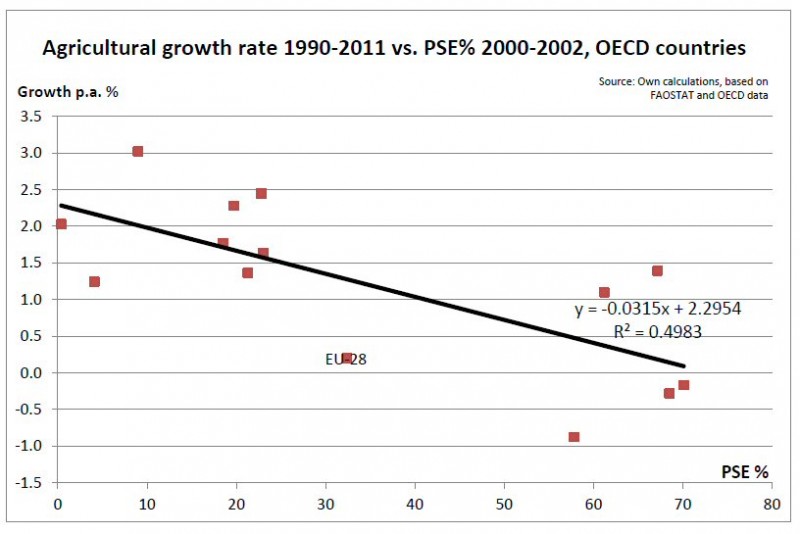
The OECD has calculated the growth rates for individual EU countries as well as other OECD countries over this period using the FAOSTAT data, with the results shown in the next figure. Countries to the left of the chart are those with rapid and sustained growth in their agricultural sector over two decades. They include Chile, Mexico, Israel, New Zealand, Canada and Turkey. Indeed, the only EU country which has had a consistent agricultural growth rate greater than 1% over the past two decades has been Spain.
Some other EU countries have had barely positive growth in agricultural output. They include Denmark (0.6% p.a.), Germany (0.4% p.a.), Austria (0.4% p.a.), Portugal (0.2% p.a.), Netherlands (0.2% p.a.) and then a number of countries with average annual growth rates of 0.1% (Ireland, Slovenia, Finland and Italy).
All other countries now an EU member in the chart have had negative growth in agricultural output, including France (-0.1% p.a.), United Kingdom (-0.4% p.a.) and Belgium (-0.4% p.a.). There is a clear concentration of new member states to the right of the chart with more significant reductions in agricultural output over this period, including Poland (-0.5% p.a.) and Slovakia (-1.8% p.a.).

It is well-known that agricultural output in the new member states collapsed in the years immediately after the end of the communist period, so it may be argued that it is unreasonable to include that episode in evaluating the long-term growth potential of the EU agricultural sector. Also, for much of this period many countries were not yet members of the EU, so the blame for the relative stagnation in agriculture cannot be blamed in all cases on EU policy.
But as a glance at the first figure will show, agriculture in the 28 EU countries actually performed better in the first decade compared to the second decade. For the period 1990-2001, growth was 0.6% per annum, but using FAOSTAT data for the period 2001-2011 it fell to 0.0%. Recall that this latter period encompassed the years of historically high food prices, yet the trend level of EU agricultural output has been flat for the past decade. Talk of the agricultural sector contributing to growth and jobs seems hollow in this perspective. (Note that Eurostat data, while confirming that growth has slowed in the second half of the period, nonetheless still shows positive growth of 0.7% p.a. for the EU-27 in the second half of the period, see below).
Is agricultural growth related to the level of protection?
What characteristics do the high-growth countries have in common? One possible commonality is that some of them are well-known for their open agricultural policies with low levels of subsidy support to their farmers. We can examine this formally by plotting each country’s annual growth rate for the entire 1990-2011 period against their percentage level of public support. For this purpose, I have chosen a % PSE figure from the mid-point of the period, covering the years 2000-2002, as being representative of the period as a whole. The results are shown in the following diagram.

There appear to be two clusters of countries. The cluster on the left consists of those countries with high growth rates and low levels of public subsidy support. The cluster on the right consists of those countries with low growth rates and high levels of public subsidy support. The apparent negative correlation between the level of support and agriculture’s growth performance is confirmed by the negative trend line.
This evidence of a negative correlation between support and growth is not, of course, evidence of causation. It could be that the high level of support arises because a country has a poorly structured agricultural sector with low growth potential, or the negative relationship might be due to some other explanatory factor. But it does highlight that growth in more open agricultural economies has been higher than in those which are more protected from global competition.
There is thus a potential contradiction between Hogan’s pursuit of a growth agenda and his insistence in the same confirmation hearing that protection for vulnerable sectors such as beef and poultrymeat will not be lowered, for example, in trade negotiations with the US in the TTIP framework.
The other feature of the diagram is the poor growth performance of the EU even given its level of support, as its actual growth rate lies well below the potential level one might have expected based on the trend line. This might be explained by the post-communism restructuring in the new member states (although, quantitatively, they do not account for a high proportion of the EU-28 output). It may be a reflection of the stance of EU agricultural policy over this period, which put more emphasis on extensification, supply controls and raising environmental and welfare standards than some of the other OECD countries. It may also reflect a reduction in the amount of production-related R&D undertaken in research institutes and private companies over this period, and an hostility to the uptake of some new technologies.
There is an ongoing debate whether higher agricultural output growth would be at the expense of the environment. The zero growth experienced in the EU over the past decade has not been accompanied by improvements in all environmental indicators, so there is scope to look for improved synergies between the two. In my view, there is no necessary contradiction provided that environmental services and values are properly reflected when farmers make their production decisions.
How best to reconcile increases in agricultural output with the protection and enhancement of environmental quality is an active area of research, under different labels such as ‘sustainable intensification’, ‘agroecology’ and ‘green growth’. The new European Innovation Partnership for Agricultural Productivity and Sustainability is another attempt to examine these links.
But is there real potential for growth in EU agriculture in the coming period given its poor performance over the past two decades? Is CAP simplification a critical factor, or do the reasons for low or zero growth lie deeper than this?
Technical note
Annual growth rates quoted in this post are calculated according to the method in the OECD report on green growth indicators. A least-squares growth rate, r, is estimated by fitting a linear regression trend line to the logarithmic annual values of the variable in the relevant period, as follows: Ln(xt) = a + r * t and is calculated as [exp (r) – 1].
FAOSTAT is used as the source of the volume index data for each country because this is used in the OECD source which prompted this post and it allows for comparisons with non-EU countries. The FAOSTAT volume index of gross agricultural production is based on the sum of price-weighted quantities of different agricultural commodities produced after deductions of quantities used as seed and feed. The resulting aggregate represents, therefore, disposable production for any use except as seed and feed. Production quantities of each commodity are weighted by 2004-2006 average international commodity prices and summed for each year. To obtain the index, the aggregate for a given year is divided by the average aggregate for the base period 2004-2006. For some earlier years, some individual country data is missing and the EU-28 aggregate is then the sum of the available data.
Eurostat index of production volume data differ from the FAOSTAT figures because of differences in concepts of production, coverage, weights, time reference of data and methods of calculation. For example, the data in the relevant Eurostat domain (aact_eaa05) are currently calculated using 2005 data, EU prices and by chaining indices calculated in the prices of the preceding year.
Eurostat data tell a somewhat more optimistic story. Its longest series covers the EU-15 for the period 1993-2013 where the annual growth rate is 0.8% p.a, falling to 0.6% in the period 2001-2011 and 0.7% in the period 2001-2013. For the EU-27, data is available only for the period 2002-2013. The annual growth rate was 0.7% p.a. for both periods 2002-2011 and 2002-2013, which is higher than the zero growth reported using the FAOSTAT data.
Photo credit: © Copyright Roger Davies and licensed for reuse under a Creative Commons Licence.
This post was written by Alan Matthews
7 Replies to “What is the growth potential of EU agriculture?”
Comments are closed.


The issue is not growth in agriculture but whether the land can stand such intensive production over time. Can one country stand huge population growth while reducing its food production land which is permanent. Can other countries stand population reduction while land stands uncultivated. Discuss.
These data are calculated using FAOSTAT data; the data from Eurostat tell a somewhat more optimistic story with a growth rate (for the EU-15) of 0.8% p.a. over a similar period, or a cumulative growth over 21 years of 19% (the differences between the two sources of data are briefly explained in the Technical Note at the bottom of this post).
Dear Allan, shouln’t it be 0.08 % pa. In the graph you do not see a 20 % growth over 20 years. And the regression says 0.02 percent growth.
Cheers JP
@Deborah
Thanks for the comment. I agree that the environmental consequences of increasing agricultural production need very careful assessment, but this was not the main point of the post. Given that the new Commissioner has made agricultural growth his main priority, I wanted to highlight the challenge this represents given the past growth performance of EU agriculture. How to achieve this in a sustainable way would require another post, and as I noted this is now a very active area of research.
Sorry, 0,2 percent
@JP
Thanks for the careful reading, and it seems my explanation of the two sources of data on EU agricultural production was not clear enough!
The graph is drawn using the FAOSTAT data, and the annual growth rate is 0.2%. However, it is also possible to derive annual growth rates from Eurostat index numbers of volume of agricultural output, which are constructed on a different basis to the FAOSTAT volume index numbers. The 0.8% annual growth rate refers to the Eurostat data, and not to the data in the chart. It is obviously open to debate whether one source, and one number, is ‘better’ than the other. I have emphasised the FAOSTAT data in the graph because I wanted to be consistent with the OECD numbers for growth rates for individual countries in the second chart. Thanks for the opportunity to clarify this.
Dear Alan, thanks for the interesting post. You mention ‘The zero growth experienced in the EU over the past decade has not been accompanied by improvements in all environmental indicators’. As far as I am aware, several (some?) did and environmental impacts which may not have, often lack an indicator or consistent data. Despite lacks and uncertainties, an indicator which is likely to have been deteriorating is erosion, esp. in Spain…(though fragmented proof). As it is shown here that Spain is also the country with the highest growth in ag. output, could be interesting in this context?
@Liesbeth
How agricultural growth impacts on the environment requires in the first instance, as you recognise, good data on environmental indicators. The European Environment Agency produces indicators for the EU http://www.eea.europa.eu/data-and-maps/indicators/ and the OECD report referenced in the post is an attempt to develop these in an agricultural context.
The interesting question you raise with the Spanish example is whether there is always a negative relationship between growth in farm output and indicators of environmental services or environmental quality. I think this was indisputably the case in the past, mainly or at least in part because these environmental values were ignored in decision-making. If we have an improved regulatory framework including, hopefully, greater reliance on market-based incentives as well as much more research into reducing the trade.offs, my prior is that this negative relationship is not inevitable, and that we can achieve both higher food production and better environmental outcomes at the same time. But this is now a heavily-debated topic!