
It has been heard and written everywhere for the last 18 months: farm incomes have gone down dramatically. After two years of carpet bombing by the media, with anything from 60 percent price fall in prices to desperate farmers spreading their milk in the fields, the consultation on the future of the CAP organized by Commissioner Ciolos suggest that many, in the civil society, are convinced that EU farmers are starving. As an external reviewer of the synthesis report of this consultation, I saw a large sample of individual contributions. My feeling is that for many people, the current low farm incomes justify subsidies, border protection and paying more attention to mechanisms to support farm prices. In France, the tone of the debates on the national agricultural law is such that for all journalists, and even more Members of Parliament, the current perception is that agriculture is a synonym for “lumpen proletariat”.
The fall in farm income experienced in 2009 was genuine. It resulted from falling output prices, while input prices had remained high. There is no question that the economic situation of many farms has been disastrous. All figures, whatever their sources, do show low incomes even when compared to period before the price peak 2007-2008. However, sugar prices have been high for quite a long time. Oilseed prices have remained steady. Butter prices recovered very rapidly in 2009. After two years of low prices, cereals prices recently reached levels that ensure a high return to most growers, and future markets suggest they will keep rising. Fertilizer prices went down. Still, most of the newspapers, politicians and the public opinion talk about farmers as the category being hit most by the economic crisis.
One explanation is that farmers’ organisations have been efficient at surfing on the agricultural crisis, stressing the low incomes and the need for assistance. It’s hard to blame them for “not missing the opportunity of a good crisis”. By playing the communication card on incomes – in particular to the ears of the European Parliament – they may even end up avoiding large budget cuts, if not complete dismantling of the CAP after 2013, something that was on the radar only 2 years ago. However, given the importance of the issue of farm income in the debates on the future CAP, we should be able to rely on good data. And on this issue, it is surprising to see that data on farm incomes are so poor and questionable.
One example of the crude statistics that have been put forward in the ongoing debate on the CAP is the way the Commission disseminates figures on agricultural income. I am seldom critical of DG Agri, which has an expertise that I find impressive and a political orientation (at least under the last three commissioners) that I find rather “fair and balanced”. However, I have a hard time with the graph below, which comes from a standard DG-Agri presentation (this one was given by Pierre Bascou in Paris but I suspect this is a graph that is part of all DG Agri representatives’ toolkit).
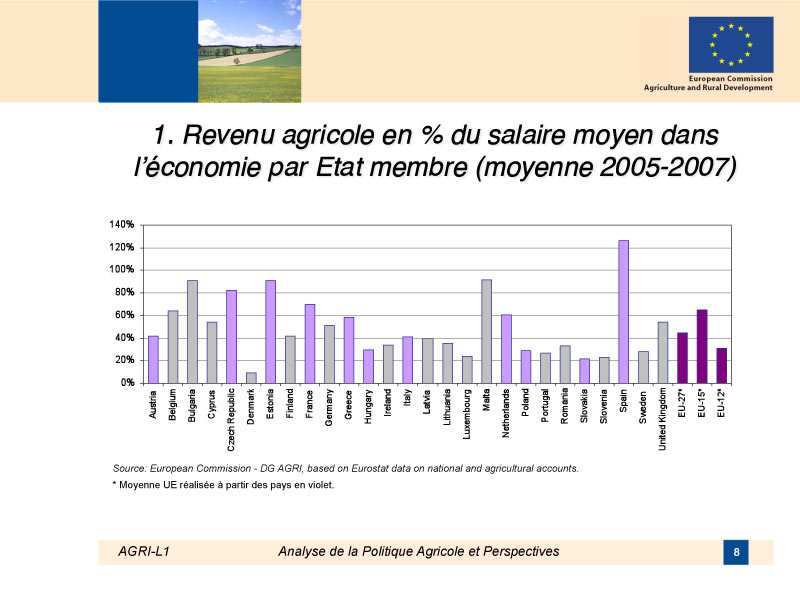
The point by DG Agri here, seems to illustrate that farmers’ incomes are low compared to the rest of the population. Hence the need for keeping agricultural policy instruments. While I can be sympathetic with the idea, I just can’t buy the figures. Indeed Spain is the only EU Member where farmers make more money than the average worker. In the EU-27, agricultural income is roughly 43% of the average income. In Denmark it is 10%. In France, it is 70%, and it is even less in the UK. And these figures are even before the large fall in income in 2009.
First, in all cases, the figures contradict fundamentally the findings of the last extensive study coordinated by Berkeley Hill at the beginning of the 2000s, by the OECD later, that compared the income of agricultural households and the average household, even if one updates this benchmark by national indexes of changes in real income over time. It contradicts the scarce national data on “professional farms” that shows that for these farmers, farm incomes are often comparable to other incomes over the period considered. Second, if farm income is only 10% of the national average, resources should be moving away from farming at a rate that far exceeds the one observed in Denmark: these figures just do not make sense from a macroeconomic point of view.
Clearly, there are several approaches to measure farm incomes. Much depend on:
– how you define a farmer (is 1 hectare or 10 beehives really enough to qualify?);
– how you measure farm labour (something done in a terrible way in the EU by the way with very crude measures such as the Annual Labour Unit, while in the United States statisticians can control for the actual number of hours working off-farm, qualification, age, gender, etc.);
– how you defined income (result of agricultural activity? Including subsidies? Including social transfers? Including rents of land leased out? Agritourism? Work carried out for other farmers? Off-farm income?);
– and which sources you start from, e.g. farm business association data or macroeconomic accounts.
I had been planning to take a deeper look at how DG Agri figures were calculated before posting anything. However, before having time to do so, I came across the recent text by Berkeley Hill, which I find very interesting. His comments are more general, but I find them particularly relevant to the DG Agri figures. He points out that the current approaches to measure farm incomes are not satisfactory, and he wonders why the different projects of measuring the income of the agricultural household have not been pursued further. I fully agree with Hill on his different points. I could also add critiques to the current approaches that he does not mention, for example:
– The EU does not do a good job with the measurement of farm income using macroeconomic accounts for methodological reasons. For example, you can pretty much get the net value added or the sectoral income you want by adopting a convention on the decay of the equipments and buildings (maximum service life, shape of the decay curve over time, e.g. geometric, linear, hyperbolic or “one hoss shay”, and if you are very smart, assumptions on the statistical distribution of the age of the buildings). All of these will affect your figure for depreciation and hence the net value added and income. There are also many possible assumptions on how you remunerate land in property by farmers, and massive assets such as plantations. For example, last time I looked at this (years ago, they may since have changed it) some member states used for the same building a depreciation period that ranged between 12 to 50 years, generating considerable differences in economic depreciation and hence in agricultural income just because of unsubstantiated assumptions. Perhaps not a big issue in time series comparisons, but so much for consistency and comparability across member states.
– Regarding microeconomic sources, the RICA (Farm Accounting Data Network sometimes called FADN) is representative of the all farm sector in some member states but much less in others. Part time farmers are not included. Large farmers refuse to cooperate and are simply not represented in some member states where collection of data is on a voluntary basis. And off-farm income is not included while it is now a major source of income in many EU agricultural households. The measurement of labour is particularly crude, with simplistic assumptions on the work of the spouse and other family labour. This is not a criticism: I am happy that this source exists since we have nothing else, and I often use it. But it hardly allows comparison of farmers’ incomes with the rest of the population.
The issue is complex and there is no simple solution from a methodological point of view. Other countries such as the United States face similar problems in defining what a farm is and what farm income amounts to. For example, USDA figures show that 87 percent of what the USDA defines as farms have less than $10 000 annually in agricultural revenue. No doubt that in the EU, such a figure would be used to show how poor farmers are. But US statisticians have managed to measure the actual income in a much more satisfactory way. And USDA figures indicate that the average household income of these farms that have less than $10 000 in agricultural sales is actually $71 000, once off-farm income and social transfers are taken into account. Something we seem unable to do in the EU, opening the door for journalists to publish dramatically low figures without the necessary precautions.
If the CAP moves towards a farm income support policy, which it did with the progressive decoupling of payments, and if farmers’ organisations stress the need for support on the basis of low incomes, one should be able to collect reliable information on farm incomes. And to see how these incomes compare to those of urban poor or other categories that are also hit by the economic crisis.
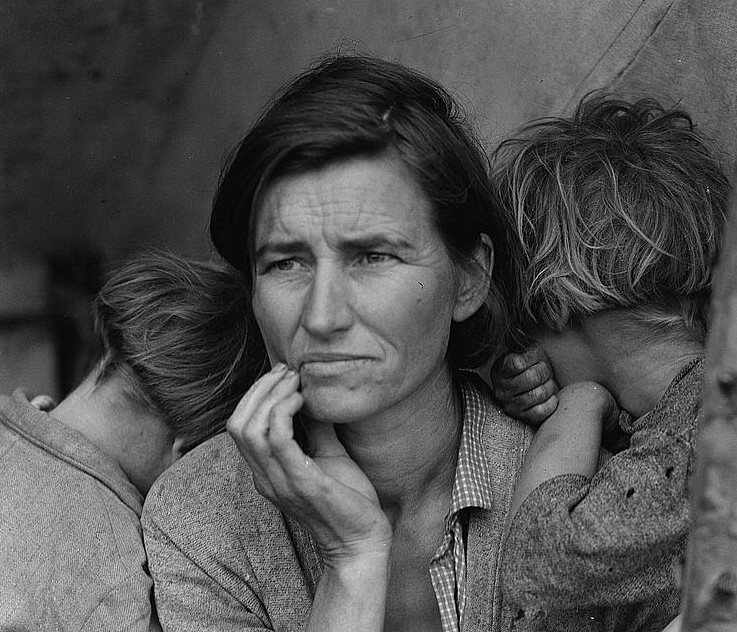
Photograph: Migrant Mother (1936) by Dorothea Lang. Lang’s photograph of a destitute 32-year old migrant farm worker and her children is among the most famous images of rural America during the Great Depression.
