
The Oxford Farming Conference which is held in the first week of January each year in the UK provides an opportunity for UK farming leaders to discuss the ‘big issues’ affecting the industry. This year, the Conference commissioned a report Power in Agriculture from the Scottish Agricultural College to examine the dynamics and implications of global agricultural power.
The purpose of the report was to examine where the economic, political and natural resource power currently lies in world agriculture, how that might change in the future, and what it means for British farmers. But the approach and findings clearly have a broader interest.
Sources of global agricultural power
The report raises three intriguing questions. What do we mean by global agricultural power? Why might it be important? And how can we measure it?
Power can be defined as the ability to persuade, compel or influence other actors to do something which benefits the actor or country exercising power. Power can be exercised by economic inducements or sanctions, by setting the ‘rules of the game’ or, ultimately, through force.
The report distinguishes three sources of global agricultural power.
- Economic power can be either public or private. Public economic power may be conferred by production capacity or importance in global trade. Private economic power is a function of the size, reach and concentration of the business firms which make up the global agricultural market at the different levels of food processing, trading and retailing.
- Political power is seen as the ability to set the agenda and to dominate the international organisations which set the ‘rules’ governing agricultural production and trade.
- Natural resource power is conferred by possession of the scarce resources needed for modern food production, such as land, water, energy and the minerals necessary for fertiliser production, and which are very unequally distributed across countries.
Report findings
The report argues that power in the global agricultural system is shifting ‘eastwards’ (towards the emerging economies) and ‘upwards’ (towards greater concentration in the hands of a smaller number of large corporations).
The report develops a ‘power index’ to make comparisons between countries. The index is constructed by ranking each country/region on a scale of 0 to 5 (where 0 means zero power and 5 means considerable power) for each power dimension and then summing the scores.
It concludes that the US and the EU continue to top the index by some margin. However, the index highlights their vulnerability in terms of natural resources. On the other hand, the emerging economies have lower political and corporate power but seem better placed in terms of natural resources.
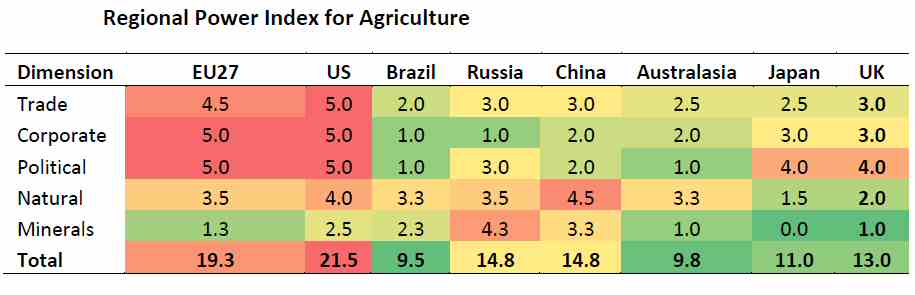 Source: Scottish Agricultural College
It would have been interesting if the report had attempted to calculate and compare the rankings on the index over time. As it is, any inferences on how these rankings are changing over time are left to the reader. Of course, the scores that populate the table are subjective and based on the judgement of the research team, so perhaps too much should not be read into the particular numbers.
Concentration of export supplies
In at least one area the report seems too pessimistic. If we think about the economic sources of public power, this might be conferred because a country has a large import market (and thus is in a position to provide economic inducements, for example, by offering market access in return for concessions in other areas) or because it is an important exporter (and thus is in a position to threaten economic sanctions by withholding supplies).
It is not necessarily the case that globalisation is leading to greater concentration and specialisation on a smaller number of exporters, which might be seen as exacerbating problems of economic power. Taking one key traded commodity, wheat, as an example, the sources of export supply have become more diversified over time.
The report does not look explicitly at how the concentration of export supplies is changing over time. Economists use the Herfindahl-Hirschman Index (HHI) to measure market concentration for purposes of antitrust enforcement. The HHI of a market is calculated by summing the squares of the percentage market shares held by the respective firms.
For example, an industry consisting of two firms with market shares of 70% and 30% has an HHI of 70²+30², or 5800. The US Department of Justice uses certain rules of thumb to determine the degree of concentration of a market. It regards a market in which the HHI is below 1500 as “unconcentrated,” between 1500 and 2500 as “moderately concentrated,” and above 2500 as “highly concentrated.”
The figure below shows HHI indices for wheat exporters for the three years 1990, 2000 and 2008. I have calculated the indices for both export quantities and export values, and both treating EU member states individually and the EU-27 as a single bloc.
 Source: Own calculations based on FAO TradeStat, figures for Wheat and Flour equivalent
 The results are consistent in showing that the global wheat market, in terms of countries of supply, is relatively unconcentrated. More important, the degree of concentration has declined over time. Smaller exporters have got relatively bigger and new exporters have entered the market to challenge the dominance of the biggest exporters in 1990. Concentration ratios are, of course, higher when the EU-27 is treated as a single exporter but the trend remains the same.
Clearly, there are important power shifts taking place in the global food system, and this report makes an interesting attempt to define and measure these. From a global welfare perspective, however, it seems at least as important to know how concentrated/diffused power is as to know who exercises it.
This post is written by Alan Matthews
Picture on home page by odegaard on Flickr, and used under a Creative Commons Licence.

If you want to read about who manipulates governments and how this is done defacto read on for just one example. This is leavsley International attempting to create a huge pig farm with a planning application which must be of concern to independent producers and consumers alike.
RE : FOSTON Pig Unit Planning Application
Read on and see the information trail
http://www.burtonmail.co.uk/News/Pig-plan-protesters-step-up-their-fight.htm
Details of who owns Midland Pig Producers that is Leavesley International.
Residents against the p.a. are wondering where MPP are getting the money from to finance this enterprise read on and find out.
http://www.leavesley-international.com/military-vehicles-c27
Leavsley Internationals business of supplying military equipment including guns to unstable regimes. Jordan is definitely one of those regimes. There is no democracy.
http://articles.cnn.com/2011-03-25/world/jordan.protests_1_demonstrators-clash-thousand-protesters-demonstration-organizers?_s=PM:WORLD
Democracy protests in Jordan
See Reform in Jordan document PDF from the IPPR in attachment
http://www.leavesley-international.com/news.asp?newsid=17
The giving of money to The Hashemite Charitable Organisation by Leavesley
The Hashemite Charitable Trust is controlled by the Jordanian royal family they are the board of trustees. The donation is effectively money to oil wheels of military contracts. Absolutely no transparent auditing of accounts to be found there. So where was the money spent? They could have given to a British based charity working in that region why didn’t they give to Save The Children, Oxfam, or even the Red Crescent .