The food system has been subject to a series of shocks, including the sharp rise in commodity prices since 2007 and the economic recession and subsequent austerity measures in many countries since 2009. These shocks are likely to have affected different countries in different ways, so what has been happening to relative food prices across countries as a result?
Two sets of food price data are of use in this regard. Eurostat has developed a food prices monitoring tool which provides data on the monthly evolution of prices at different levels of the food value chain (commodity, processor and consumer) for EU countries. However, these data do not allow a comparison of the absolute level of food prices. For this, we need to look at Eurostat’s price level indices (PLIs) which are calculated as part of the Eurostat-OECD Purchasing Power Parities Programme.
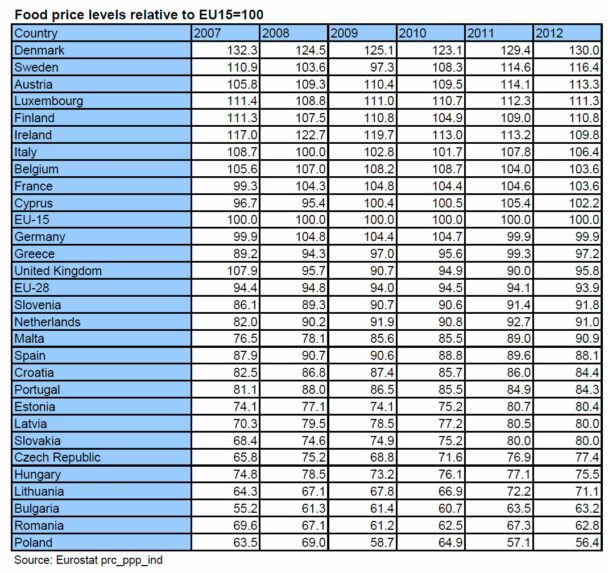
National prices are collected for around 500 comparable food and drink products. The results of the survey are expressed as price level indices, which provide a comparison of countries’ price levels with respect to the European Union average. The table below shows this information for the 28 EU countries since 2007, where the absolute level of food prices in each country is expressed relative to the EU-15 average.

Comparative food price levels
What is of interest is to look both at the rankings and how they have changed over time. The most expensive food prices are found in the Scandinavian countries, Austria and Luxembourg in 2012, closely followed by Ireland. The countries with the cheapest food are all the new member states. Poland is the country with the cheapest food in the EU-28. Food prices in Cyprus are actually slightly higher than in the EU-15 as a whole.
Significant changes in the rankings over the period 2007 to 2012 are relatively few. Countries where food has become relatively more expensive include Austria and Greece and some of the new member states (Estonia, Latvia, Slovakia, Czech Republic and Bulgaria). On the other hand, countries where food has become relatively cheaper include Ireland and UK as well as in some other new member state, such as Romania and Poland. Exchange rate movements against the euro can influence the trend in relative prices in the non-euro member states.
High relative food prices do not necessarily imply a less efficient food distribution chain; they may also reflect generally higher costs in one economy compared to another. To eliminate this effect, we can calculate ‘real’ food prices relative to the EU-15 average by dividing by the PLIs for total household final consumption expenditure as in the table below (only the EU-15 countries are shown). The resulting indices are much more tightly dispersed around the EU-15 average, but with some obvious outliers.
Both Austria and Greece, for example, have higher food prices than their general price level would predict, which may indicate a less efficient or less competitive food marketing system in these countries. On the other hand, both the Netherlands and the UK have much lower food prices than their general price level would predict, suggesting that these countries benefit from more efficient logistics and distribution systems and a higher level of competition.

Data caveats
Some words of caution are necessary in the interpretation of these figures. First, the prices collected include whatever level of VAT is imposed on food. In Ireland and the UK, for example, food is mostly zero-rated, while in Denmark food is subject to the standard 25% VAT. So part of the country differences in food prices reflects differences in VAT rates. Ireland, in particular, would seem to have relatively high food prices even compared to the Scandinavian countries when this differential tax treatment is factored in.
Another point is that the surveys collect prices on the basis of what the supermarkets ask, which is not necessarily the same as what consumers pay. Supermarkets may run promotional offers, two-for-one deals or other forms of discounting which may mean that consumers pay less than the standard price. If the use and frequency of such promotions differs across countries, this could also affect the rankings. If a special offer in one outlet induces a large number of consumers to buy the product there at a low price this will affect the average price paid by consumers but not the average of the price offers collected.
Although the statistical offices try to survey comparable goods where possible, consumers may value the provision of additional services in some stores (wider product selection, personal service) as compared, say, to shopping at a discount store. Although the same product may be priced in the two kinds of stores, they are effectively not the same product. Thus, differences in outlet structure across countries can influence the rankings. Differences in typical package sizes across countries may also influence the relative prices paid
Indices based on Purchasing Power Parity prices are not the same as nationally-weighted average prices. PPP prices are collected once every three years for a limited range of standard products. Indicative prices are collected only for capital cities but then adjusted by a spatial coefficient suggested by each national statistical agency to derive a national indicative price. The method used to aggregate product PPP prices to allow comparisons of group average prices to be made can also influence the results.
Eurostat has produced a Statistics in Focus brief which provides a more thorough analysis of price differences for food, beverages and tobacco across EU countries. It points out that a comparison of the price dispersion within the EU observed on the basis of the surveys conducted since 2003 shows that prices have converged for each main group of products. Price differences have decreased most for food and tobacco and least for non-alcoholic beverages. While until 2008 the convergence was quite pronounced, since 2008 convergence has slowed and even reversed for some categories. This may be evidence of the differential impact of the commodity price increases and economic shocks since 2008.
This post was written by Alan Matthews.
Photo credit: Wikipedia under a Creative Commons Licence
2 Replies to “Comparative food prices across the EU”
Comments are closed.


Professor,
These lists have little value.
The problem is that consumer prices can be taken at different points of sale, at different timing.
In the EU you find different distribution channels, big supermarkets, medium supermarkets, small, discounters, small shops, open markets etc.. The market share of each type of sales is in all MSs different.
Several chains negotiate promotion in specific weeks.
In some member states the food basket is limited chosen in function of local production, f.e, in Belgium the highly subsidized tomatoes and apples.
Is there somebody who is willing to call for standardization of this information?
@Luc
Thank you for this comment. You are absolutely right that the data problems in making these comparisons are severe, and I mention these also in the post. However, my view is that these rankings do contain some valuable information despite these problems. First, the rankings do coincide with my casual empiricism (the rankings are in line with my own experience). Second, and more important, even if the absolute comparisons may be suspect for the reasons you mention, the trends over time can still tell a story because then the different distribution channels, etc. are held constant. For this reason, more attention should be paid to the trends over time shown in the post.
It would indeed be good to have more comparable information and Eurostat does have a programme to try to improve these statistics. But I suspect it will take some time for this to occur.