In evaluating the pattern of budget transfers to agriculture, most of the focus is on the transfers through the EU budget. The negotiations on the Multi-annual Financial Framework (MFF) were closely followed because of their importance for the size of the CAP budget in the overall EU budget in the coming programming period.
However, in addition to EU transfers farmers also receive significant transfers from member state budgets. These take two forms: member state co-financing of CAP Pillar 2 expenditures (plus some allowed top-ups of Pillar 1 payments), and state aids paid by member states to their farmers. A proportion, but not all, of agricultural state aid represents member state spending on measures equivalent to rural development measures which would be eligible for funding under Pillar 2 if the national allocations were bigger, but which are funded instead by national exchequers.
The political economy of budget support to farmers is different at the EU and member state levels. Thus we would expect different trends in the evolution of budget support to farmers in the EU budget and at member state level. The EU CAP budget is determined at irregular intervals as part of the MFF process, most recently in 2006 for the 2007-2013 MFF and this year for the 2014-2020 MFF. Actual CAP expenditure tends to stay close to the agreed MFF ceilings given that the most volatile component, market management expenditure, has greatly diminished in importance.
Member state financing is likely to be more sensitive to current economic conditions as it is determined on an annual basis through each country’s normal budget process. While Pillar 2 co-financing is necessary if a country is to draw down its full allocation of EU funds, and thus may be seen as partially pre-determined, in practice the EU has adjusted the co-financing rates upwards for countries in financial difficulty (for example, in December 2011 the Council and Parliament adopted a Commission proposal that allowed a temporary increase of EU co-financing up to 10 percentage points for countries receiving special macro-economic assistance (Ireland, Latvia, Greece, Portugal and Romania). State aid expenditure is likely to be even more sensitive to the economic business cycle, becoming more generous in times of economic upswing and subject to greater cutbacks during downswings.
Do the data confirm this hypothesis? Two data sources are available. The first is the data that member states notify to the Commission on their state aids. State aid data to agriculture is available on the DG Competition website for the period 2002-2011. In addition, the annual Producer Support Estimate (PSE) prepared by the OECD contains describes budget support to farmers with a detailed breakdown between EU and national sources of funding. While the Commission database only captures state aid, the OECD database in addition includes national co-financing of Pillar 2 plus other national aids, such as the national top-ups paid to farmers by the new member states following their accession.
DG AGRI data on state aids
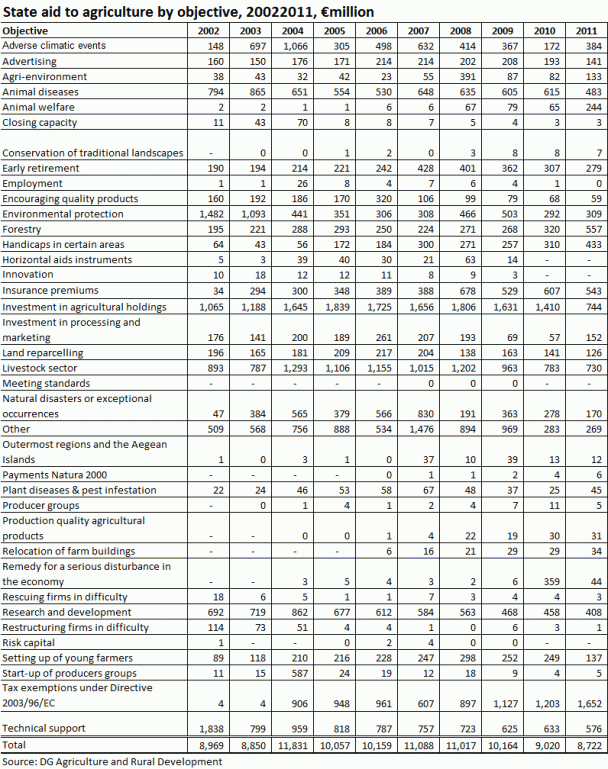
All agricultural state aid must be notified to the Commission under state aid rules. The amounts and principal objectives of the state aid granted by member states in the period 2002-2011 are shown in the following table. Expenditure is spread across most items in the table, but with some concentration of aid in the categories ‘investment in agricultural holdings’, ‘aid to the livestock sector’, disaster aid (considering the categories ‘adverse climatic events’, ‘animal diseases’. ‘natural disasters’ and ‘plant diseases’ together), and tax exemptions on fuel and electricity.

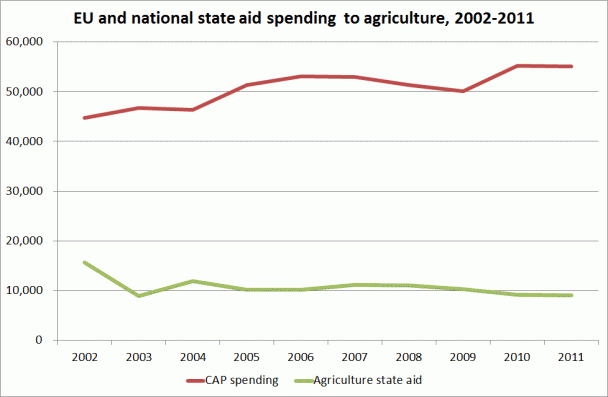
The trend in national state aid compared to EU CAP spending is shown in the following diagram. The agricultural state aid included in this figure also encompasses a small amount of aid which is not reported to DG AGRI but as general state aid notified to DG Competition. CAP spending includes market management expenditure as well as direct payments to farmers.
The ratio of state aid to CAP spending was at a peak in 2002, at 35%, but fell to 20% for the years 2003-2011. There is some evidence in the figure that state aid expenditure has been falling during the recent recession years while EU CAP spending has continued to grow. The ratio of state aid to CAP spending was 21% in the years 2003-2008 and 18% in the years 2009-2011.

OECD evidence
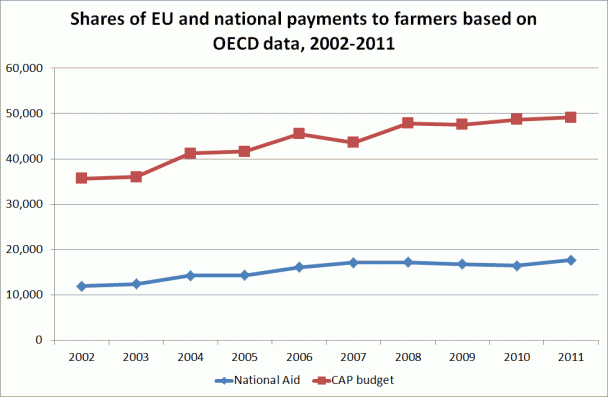
A more comprehensive picture is provided by the OECD PSE data and shown in the figure below. Here CAP spending excludes spending on market management measures as in the OECD dataset this is not measured explicitly but is captured in the concept of market price support, which is excluded from the budget figure. This explains why CAP spending in this second figure appears somewhat lower than in the previous one.
The OECD data does not show the spike in national spending in 2002. Nonetheless, for comparison purposes we exclude this year. The ratio of national to CAP spending over the 2003-2011 period is 36%, a higher figure than for state aid because the OECD figures also include the national co-financing of Pillar 2 measures as well as permitted top-up payments in Pillar 1. However, unlike the state aid data, there is no evident decrease in spending during the recession period. Indeed, the ratio of national to EU spending was 36% in 2003-08 and 35% in 2009-2011, a not significant difference.
It appears that taking account of national expenditure on co-financing removes the ‘recession’ impact on the more discretionary state aid expenditure. In this context, it is worth observing that the higher co-financing rates for the ‘bailout’ countries were only agreed in December 2011 and so would not show up in these figures.

Implications
What these figures show is that, in looking at budget transfers to agriculture, both national as well as EU expenditure should be examined. For every five euro contributed by the EU budget, national exchequers contribute a further two euro both in co-financing EU expenditure as well as through state aid expenditure. Over the past decade, it appears that national and EU expenditure have moved closely in tandem, but there is some evidence that state aid expenditure is more ‘discretionary’ and thus more closely aligned to general economic circumstances.
There are different ways to compare CAP spending in the 2014-2020 MFF with CAP spending in the current 2007-2013 MFF. Excluding expenditure on market management, the sum of spending on direct aids and rural development has been cut by around 6% in real terms (Table 14 in this European Parliament report) but if account is taken of the movement of some Pillar 1 expenditure items, such as aid to deprived persons, to other budget headings, arguably the real cut is somewheat smaller.
This relative stability in CAP spending in the 2014-2020 MFF (negotiated in much more difficult economic circumstances in 2012-2013) compared to the 2007-2013 MFF (which was negotiated in the more relaxed fiscal environment of 2005-2006) suggests that different political economy factors play out in negotiating the EU budget for agriculture than at the national level.
This issue has been discussed in a study for the Bertelsmann Foundation which explored whether the CAP adds value to agricultural spending, a study which I discussed in this post. The findings of that study ran counter to the conventional wisdom which has held that centralising agricultural spending at EU level has tended to inflate the overall volume of spending, in part because of the so-called ‘restaurant table’ effect (see the previous post for an explanation). In contrast, the study found that, for recent years, national agricultural spending would have exceeded CAP spending if agricultural policy had been nationally-financed. The authors concluded that the CAP helped to reduce agricultural spending and thus had a positive effect on European value added.
The methodology used by the authors was to build a model relating national agricultural spending to particular political and economic characteristics of a country using data on non-EU countries such as the US, Canada and Switzerland. They then applied this model to the EU member states to predict their individual levels of agricultural spending if they were all running independent agricultural policies.
My approach is based on a direct comparison of how member states use their discretionary power to set the level of state aid to agriculture and to compare the trend in national spending on state aid with CAP spending. My hypothesis is that the MFF approach to CAP spending introduces a rigidity in agricultural spending which tends to tame the exuberance of spending in good times but to help to keep it up in bad times. There is evidence to support this hypothesis in the pre-recession years in the Bertelsmann Foundation study, which shows that CAP spending undershoots their predicted level of national spending. But that study predicts that national spending on agriculture would have soared, relative to the CAP, in the recession years. To me, this is a counter-intuitive finding and it is not supported by the evidence of what is happening to discretionary state aid expenditure. It seems it would be worthwhile to investigate this apparent paradox in greater depth.
Picture credit: European Parliament

Europe's common agricultural policy is broken – let's fix it!
