

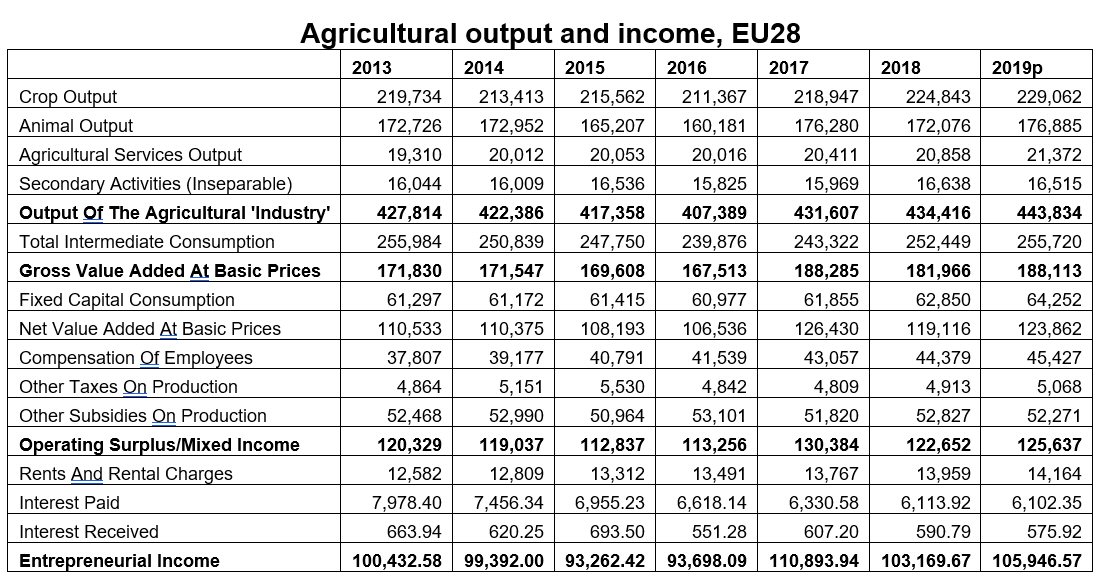
Eurostat has now published preliminary estimates of 2019 agricultural output and income. The value of agricultural output in current prices shows a small further increase in 2019 as compared to 2018. Compared to the previous peak in 2013, agricultural output value has grown by just under 4% in the past six years. This is mainly due to an increase in the value of crop output, with the increase in the value of livestock output lagging behind. However, because of greater spending on intermediate consumption, gross value added in agriculture remains just below the record 2017 level.
Operating surplus (the return to land, capital and family labour) also increased compared to 2018 but is still well below the record 2017 level. Compared to the previous peak in 2013, operating surplus has increased by 4.4%. Allowing for payments on borrowed capital and rented land, the figure for net entrepreneurial income (family farm income) also shows a small recovery compared to 2018 and has increased by 5.5% compared to the previous peak in 2013.
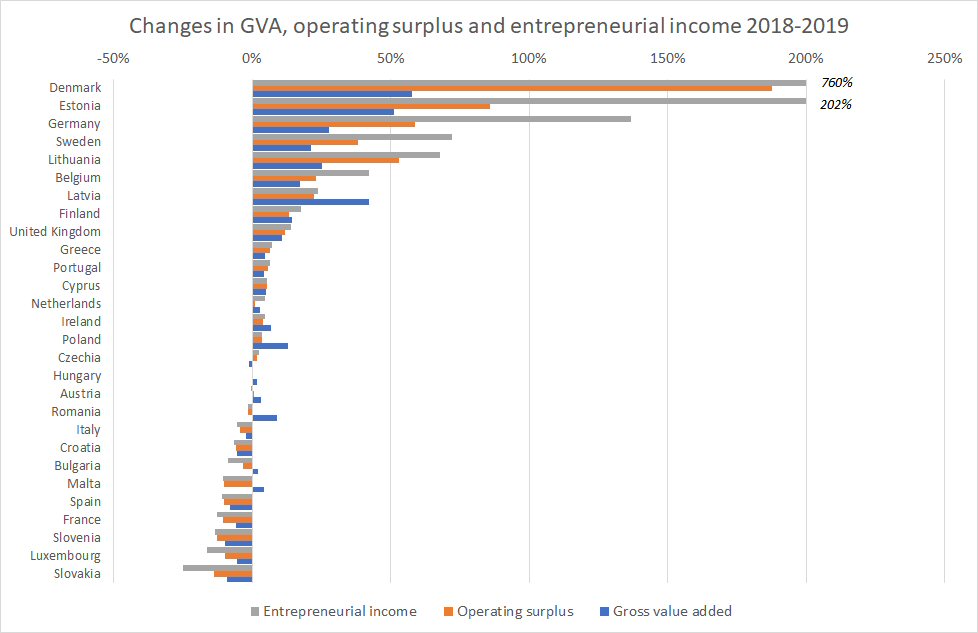
Averaging over the EU28 conceals very different changes at the country level (and even more so at regional and enterprise level). The country changes for three variables, gross value added (GVA), operating surplus and net entrepreneurial income are shown in the following chart. In general, volatility increases as one moves from GVA to operating surplus to net entrepreneurial income as the degree of leverage increases.
For example, GVA in Denmark increased by 58%, operating surplus by 188% and entrepreneurial income by a whopping 760% (from €168 million in 2018 to €1,446 million in 2019, the best outcome ever obtained by Danish farmers, and no doubt particularly welcome as it follows some years with negative income).
Similarly, GVA in Estonia increased by 51%, operating surplus by 86% and entrepreneurial income by 202% in 2019 compared to 2018.
Germany also shows a strong recovery, with GVA increasing by 28%, operating surplus by 59% and entrepreneurial income by 137%, though the latter still lies well below the levels observed at the start of the decade.
The main reason for the sizeable differences in the volatility of family farm income across countries is that in some countries the family farm income share of total output is quite small. This means that even small changes in the value of output or inputs translate into much larger ‘shocks’ to family farm income – this is what I meant when I describe the latter as highly leveraged.
In the EU28 in 2018, family farm income (FFI) amounted to €105 billion compared to the value of output of €434 billion or a share just under 25%. For the countries with the most extreme per cent changes in family farm income, the percentage share was much lower.
In Denmark, for example, FFI in 2018 was just €168 million compared to gross output value of €10, 316 million. In 2019, the latter increased by €1,333 million to reach a total of €11,640 million, an increase of 13%. However, this resulted in an increase in FFI of €1,277 million, from €168 million to €1,446 million, or an increase of 760%! The absolute values the changes were very similar but they translate into very different percentage changes because the base levels are so different. A similar explanation applies in the case of Estonia and Germany although not to such an extreme extent.
At the other end of the table are those countries that experienced a fall in entrepreneurial income in 2019, including Romania, Italy, Bulgaria, Spain, France and Slovakia.
Farmers across the EU may operate in a single market, but output and income trends remain highly divergent due to differences in enterprise specialisation, production systems, weather conditions and market trends.
This post was written by Alan Matthews
17 December 2019: The post was updated to add the paragraphs explaining the notion of leverage and how it explains the large percentage changes in family farm income.
Picture credit: PaisJoana public domain image

In Estonia, we had a record high cereal harvest in 2019 (+73% compared to 2018). Also, in 2018 GVA was at a low level (same as in 2004 in current prices). Entreoreneurial income in 2018 was similar to 1997 figure (in current prices). Hence the high growth rates compared to 2018.