
I wrote a blog post in March this year “Food price inflation gathers pace” which used inflation data up to February. I concluded that post by noting that “the explanation for the continuing rise in food price inflation is mostly likely down to the lags in transmitting price changes through the food price chain. Food price increases in the past year, though very high, have not fully reflected the increases in prices at primary producer level. As food manufacturers and retailers continue to adjust their prices to these higher input costs, food price inflation is likely to continue at a high level”.
In this post, I bring the story up to date using information up to June 2023. My prediction in March 2023 seems borne out by the data. Food price inflation remains very high but there is evidence that food prices at EU level have stabilised and that we can expect some modest decrease in the coming months. The following graphs illustrate this story.
Food price inflation remains high
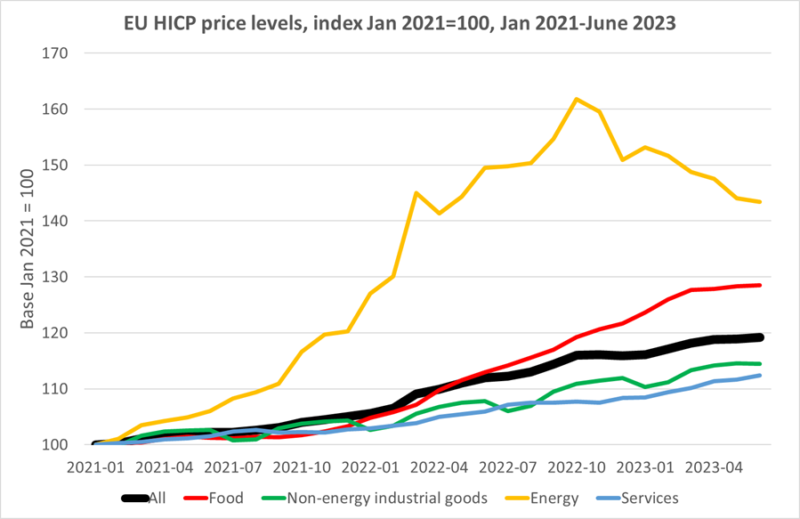
The first diagram shows the evolution of price levels for the main components of the Harmonised Index of Consumer Prices (HICP) up to June 2023. Over the 2.5 years since January 2021, overall prices have risen by over 19%, driven by increased energy and input prices but also, in the past 12 months associated partly with the Russian invasion of Ukraine, also by rising food prices which have risen by 29% over the same period. These are the average trends for the EU as a whole; individual Member State experiences will differ.
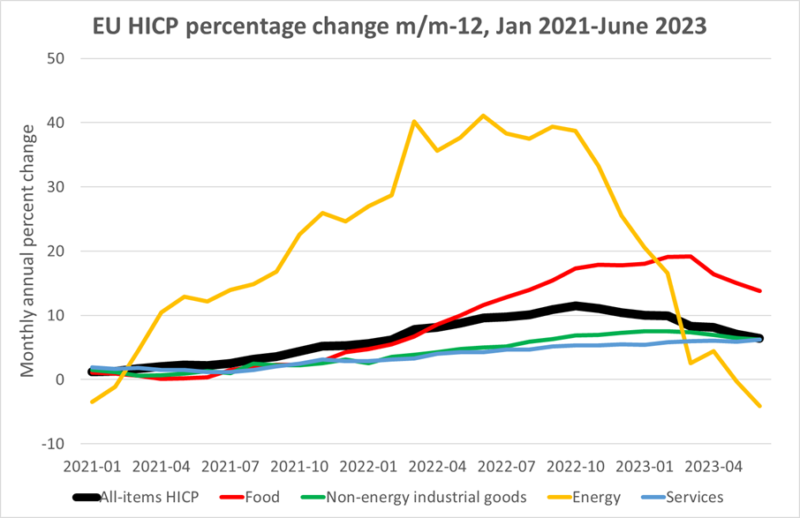
The next diagram shows the monthly annual average rate of inflation for the various HICP components. Overall inflation (the black line) has fallen from its peak of 11.5% in October 2022 to a rate of 6.4% in June 2023, still well above the ECB’s target rate of around 2%. This is mainly due to the fall in energy prices in recent months. The annual rate of increase in food prices has been slowing but is still abnormally high, falling from a high point of 19.2% in February to 13.8% in June 2023. While the rate of increase in prices of non-energy industrial goods has also fallen slightly in the last couple of months, the rate of increase in prices of services has if anything been gathering pace. Despite the slowing rate of food price inflation, it continues to drive the overall rate of increase in consumer price inflation.
Prices and margins along the food chain
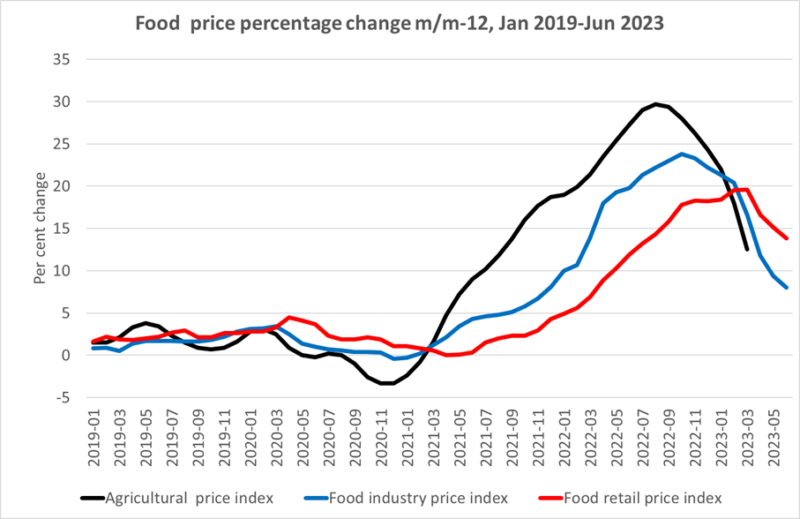
Using the Eurostat Food Price Monitoring Tool, we can trace how the increase in retail food prices reflects price increases in the downstream parts of the food supply chain. The next chart shows price developments at farm level (agricultural price index), food industry level and retail level. Here I show the trend data for a slightly longer period starting in January 2019, to better illustrate the divergent trends in these three indices after January 2021.
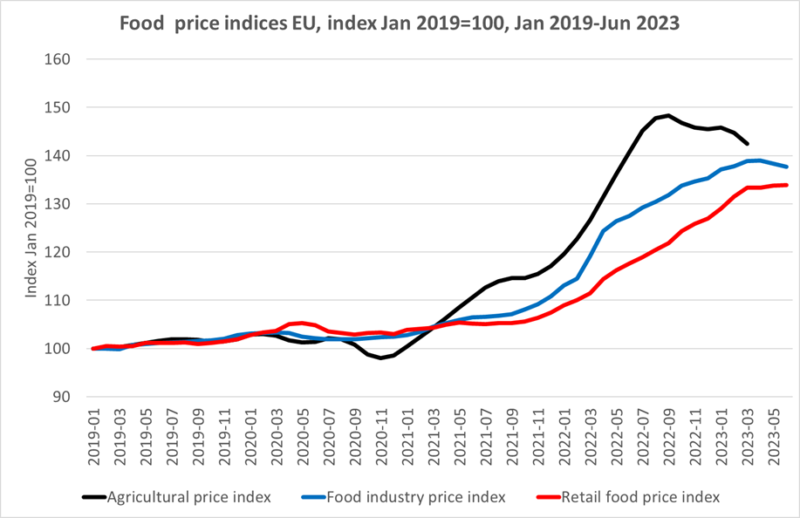
The data illustrate the point I emphasised in my previous post that price transmission along the food chain takes time, and as a result margins along the chain will evolve differently. Agricultural commodity prices were the first to begin to move, recovering strongly from the trough in November 2021 and were already 23% above the January 2019 level at the end of February 2022 when Russia invaded Ukraine and pushed nearly 50% higher by September 2022 due both to higher input costs and higher world market prices. Food processors did not start to raise prices in earnest until September 2022 after which prices rose sharply. In turn, retail food prices did not start to rise seriously until after November 2022. During that period, first food manufacturer margins and later supermarket margins were being squeezed.
Agricultural commodity prices began to turn in September 2022 and have fallen somewhat, but not dramatically, by March 2023 which is the latest data for this series in the Food Price Monitoring Tool. Again, we see price transmission occurring with a lag. Food processing prices did not peak until March 2023 after which they have begun to fall. Finally, food retail price increases have slowed in the recent months but have not yet begun to fall.
The evolution of prices of these different elements in the food chain can also be illustrated using the monthly annual rates of price inflation, shown in the final diagram. The displacement of the peaks in the three series shows clearly the delays in price transmission both when prices were rising and now that they are falling. While the overall level of food prices continues to rise, the rate of increase in those food prices is now falling, suggesting that, all else equal, we will also see some modest fall also in the level of food prices in the coming months.
Of course, it may be naive to assume that everything else will remain equal in the coming months. EU harvests will be affected by adverse weather conditions that will impact prices. The ending of the Black Sea grain deal will put upward pressure on world market prices – the FAO Food Price Index in July increased slightly, although this was the result of a rise in the vegetable oils price index and cereal prices even fell slightly. Non-commodity costs such as labour may increase in response to the more sustained rate of price increases experienced in the past year. Still, if the anticipated modest fall in food prices comes about, this will come as some relief to governments that have become increasingly conscious of the social impacts of rising food prices and have resorted to various measures to try to restrain these price increases.
This post was written by Alan Matthews.
Photo credit: PxFuel royalty-free image.
