In my previous post, I discussed recent EU farm income trends based on recently-updated Eurostat data. Earlier this week, DG Agriculture and Rural Development released an update of its CAP Context Indicators. These are part of a set of CAP Indicators linked to output, results and impact which are aimed at measuring the effects of policy measures (the value of these indicators is discussed by Koester and Loy in this post).
The Context Indicators are intended to monitor general contextual trends in the economy, environment and society which may affect the performance of the CAP. There is a wealth of useful information in the short fact sheets which accompany each indicator. A particularly valuable feature is the ability to download the indicators as Excel files as well as pdfs for further analysis.
Two of the sectorial indices address farm income trends – C.25 Agricultural factor income and C.26 Agricultural entrepreneurial income. The relevant fact sheets provide useful complementary insights to my previous post into the state of EU farm income defined as the reward to factors of production engaged in agricultural activity. The agricultural entrepreneurial income fact sheet makes clear that this indicator does not measure the total income of farmers or farm households. Interestingly, the preliminary 2015 estimates of factor income and entrepreneurial income used in the Context Indicators are markedly more pessimistic than the more recent Eurostat figures for that year that I quoted in my post.
US farm income comparison
The recent trend in EU income from agriculture can be compared to what is currently happening in the US (this column by Pat Westhoff gives a useful background to the US situation). The diagram below shows the trends in both agricultural factor income and agricultural entrepreneurial income in both countries in nominal terms (EU income is measured in euro, and US income in dollars, so the absolute levels are not comparable; as in the last post, Croatia is not included in the EU27 figure). The US data are available here.
The graph shows that US farm incomes enjoyed much greater growth in the years since 2001 but both peaked in 2013. Since then, the fall in US income from farming has been much more dramatic than in the EU. US family farm (entrepreneurial) income has fallen by 50% in the past two years (albeit from historically high levels). These figures include direct payments and government support, suggesting that the much-vaunted US support system may not provide much of a safety net after all.

This post was written by Alan Matthews
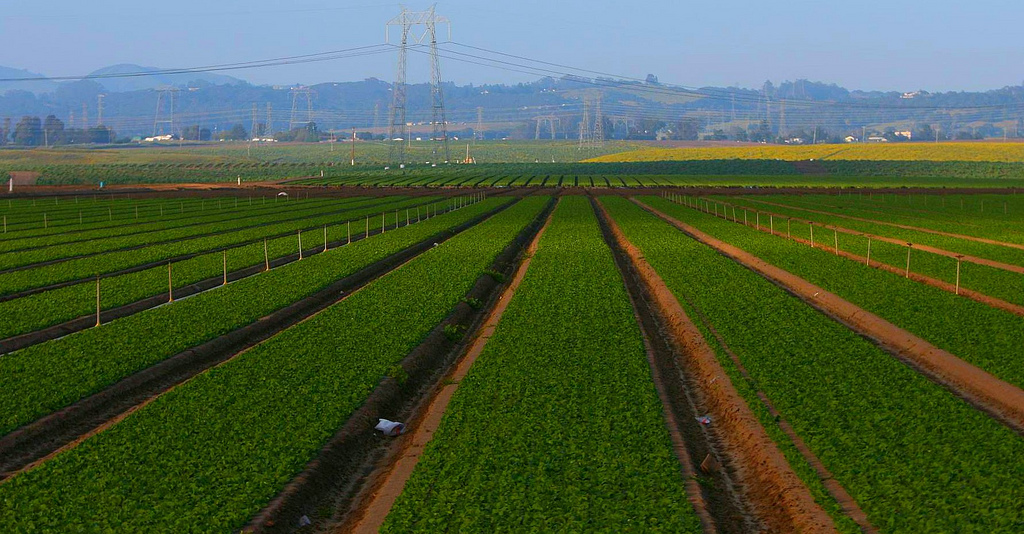
Photo credit: Monterey County, Richard Masoner via Flickr, licensed for re-use under Creative Commons licence.


