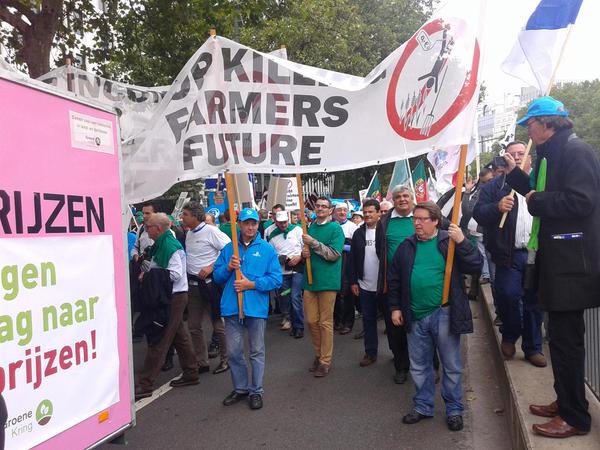
Earlier this month, without any fanfare, Eurostat produced its estimates of farm income for 2015 (see its database domain aact_eaa06 under the Economic Accounts for Agriculture, EAA). Given the noisy campaign by the farm lobby in recent months for additional support to the sector, one would expect the figures to show a sector in dire straits, reeling from crisis. There are, of course, individual sectors in trouble. There are individual member states where farm incomes over the past two years have taken a very serious hit. And there are individual farmers in all sectors, particularly those who are heavily borrowed, who have run into financial difficulty. But, perhaps surprisingly, the sector as a whole seems to be holding up well in the face of recent market shocks.
According to the preferred Eurostat farm income indicator, farm incomes in 2015 were either 1% above the average for the previous five years or 2% below the average for the previous three years. Using another indicator which better reflects family farm income, the 2015 figure is 2% below the previous five-year average and 4% below the average for the previous three years. So, farm incomes fell in 2015, but they remain broadly within the range of the recent past. European agriculture as a whole is showing remarkable resilience to recent shocks.
What we mean by farm income
Before looking at the figures in more detail, it is worth clarifying what is meant by farm income and how Eurostat measures it. A recent report by Berkeley Hill for the European Parliament Farmers’ Incomes in the EU Member States provides an exhaustive critique of farm income concepts and laments the absence of statistics on the income of agricultural households including both farm and off-farm income. As Hill argues, the most appropriate indicator to measure whether the CAP is fulfilling its objective of “ensuring a fair standard of living for the agricultural community” is the disposable income of the agricultural household. However, despite some efforts to collect such data in the past, there is currently no working system for agricultural household income statistics in the EU.
Instead, Eurostat has developed three indicators (A, B and C) to measure the reward from agricultural activity. Updated 29 March 2016. For a further discussion of the weaknesses of these income indicators, see the previous post by Ulrick Koester and Jens-Peter Loy.
Indicator A: Index of the real income of factors in agriculture per annual work unit (AWU). This indicator starts with the reward to all the fixed factors of production (land, capital and labour) regardless whether or not they are owned by the farmers, and whether or not the labour is hired or part of the farmer’s family. It is then deflated and divided by the estimated total number of annual work units in agriculture.
Indicator B: Index of real net agricultural entrepreneurial income per unpaid annual work unit (AWU). In calculating entrepreneurial income, the costs of paid labour, paid interest and paid rent are deducted, so this indicator is a reasonable approximation to what we can consider as family farm income. As Hill notes: “This is appropriate for countries where agriculture is organised almost totally as unincorporated holdings (family farms).” Like Indicator A, it is also deflated but divided by the estimated number of family annual work units in agriculture.
Indicator C: Net entrepreneurial income of agriculture. The important point about this indicator is that it is not calculated per unit of non-hired labour and so is suitable for uses involving countries where the output from corporate farms is an important part of the total.
Trends in agricultural income
Before looking at the income situation in AWU terms, the following graph shows the total income derived from agricultural activity over the past 15 years using the two indicators: factor income and entrepreneurial income, both in current prices and in real terms (data for Croatia are available since 2005, but I have deliberately excluded Croatia from the chart because it only joined the EU on 1 July 2013). Prior to 2008, taking account of inflation makes a difference to the trends, but after 2008 inflation has been so low that the current and real trends closely follow each other. In nominal terms, agricultural income (whether measured as factor income or entrepreneurial income, i.e. family farm income) has been higher in the second half of the period compared to the first. In real terms, the downward trend in the first half of the period appears to have stabilised in the second half of the period although much will depend on the outturn for 2016.
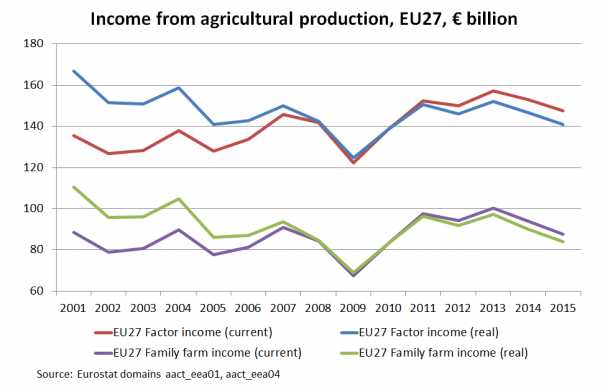
Total agricultural income has fallen in the past two years, with a more pronounced fall in family farm income than overall factor income. Family farm income has fallen by around 13% compared to its 2013 level and in 2015 was around 10% below the average for the previous 3 or 5 years. The corresponding fall in factor income was around 6-7% compared to 2013 and was running between 2-5% below the average for the previous 3 or 5 years.
However, to understand what these trends mean for individual farms and those working in agriculture, we need to take into account the fall in the number of farms, and more specifically, the smaller agricultural labour force. There is a steady decline in the agricultural labour force of around 2% per annum which seems little influenced by conjunctural factors. This reflects the movement of labour from relatively low-productivity employment in agriculture to higher-productivity job opportunities in the non-farm sector
In agricultural structures characterised by family farms, this out-migration usually takes place with generational transfer of farms, though it can also occur through an increase in pluriactivity among existing farmers and a growth of part-time farming. While many people regret the shrinking labour force in agriculture, this movement of people off farms reflects fundamental productivity gaps and world-wide contributes to a rising standard of living (see Olper et al. 2013 for an empirical analysis of this phenomenon).
We next turn to look at the trend in the Eurostat farm income indicators which take account of the numbers working in the agricultural sector.
Trends in real agricultural factor income per AWU
The trend in Indicator A for the EU-27 and disaggregated by the EU-15 and EU-12 is shown in the chart below. The overall trend for the EU-27 is dominated by the old member states which accounted for 84% of total factor income in 2010 (the base year for the indices).
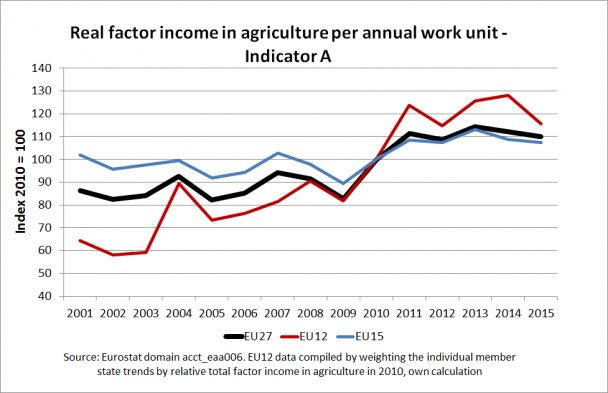
The improvement in the second half of the period is much more pronounced using this Indicator. Not surprisingly, factor income in agriculture per AWU rose much more rapidly in the new member states which joined the EU in 2004 and 2007, respectively. This reflects not only the gradual extension of CAP payments to these countries, but also a more rapid decline in the farm labour force than in the old member states during this period.
However, agricultural factor income per AWU has fallen by more in the new member states since 2013. In the old member states, Indicator A has fallen by 4% since the record high point in 2013. However, its 2015 level was exactly the same as the average for the previous 5 years, and just 2% below the average for the previous 3 years. In the new member states, the fall since 2013 has been greater at 8%. The 2015 level was 2% below the average of the previous 5 years and 4% below the previous 3-year average.
Trends in real entrepreneurial (family farm) income per family AWU
The trend in Indicator B gives a better indication of what is happening to family farm income per family AWU (bearing in mind the difficulties of interpreting this indicator in those member states with a large share of corporate agriculture). This is shown in the next chart.
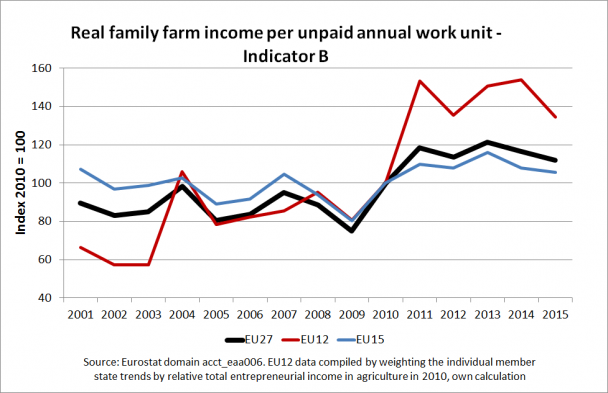
The improvement in family farm income per family AWU is even more marked in the new member states compared to Indicator A, but otherwise the trends follow a very similar pattern. However, as noted at the outset, Indicator B shows a somewhat greater fall in income since 2013 than Indicator A. Again, this is more pronounced in the new member states, where family farm income per family AWU has fallen by 11% in 2015 relative to 2013, compared to 9% in the old member states. Nonetheless, the 2015 level is just 3% below the average for the previous 5 years in the new member states (2% below in the old member states) and 8% below the average for the previous 3 years (compared to 4% below in the old member states).
Member state differences in farm income trends
When the trends by member state are examined, the variation is much greater (see next table). It is a paradox that, despite the existence of the common market in agricultural products across the EU, each year there are great differences in farm income trends between the member states. This partly reflects differences in the composition of output by member state, but also differences in the share of intermediate inputs in gross output and (for family farm income) differences in the reliance on external factors of production by member state.
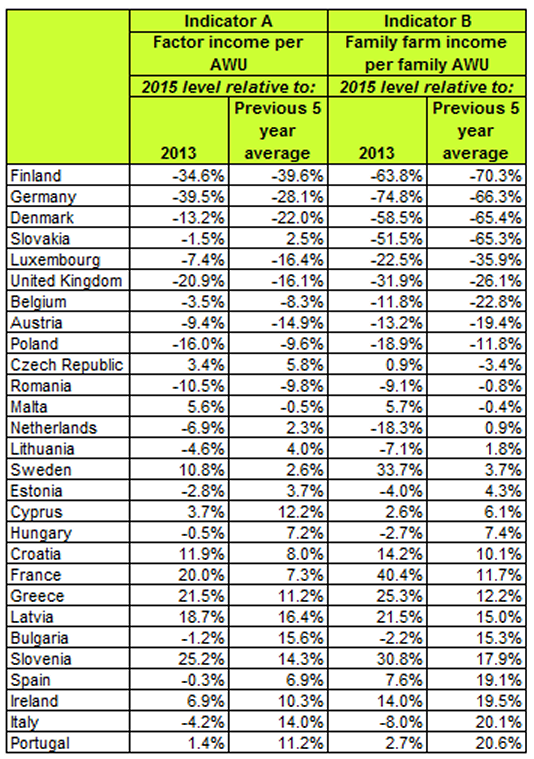
The table lists countries with the largest relative fall in family farm income per family AWU at the top. Some country rankings can be explained by well-known structural characteristics. The steep fall in Indicator B in Denmark compared to Indicator A, for example, reflects the high indebtedness of many Danish farms. For Slovakia, the dominance of corporate farming makes the figures for family farm income hard to interpret. But other country comparisons are harder to explain without delving deeper behind the figures. Factor income per AWU has gone up by 20% in France since 2013, but has gone down in Germany by 40%. Factor income per AWU in the UK has fallen by 21% since 2013, but it has risen in Ireland by 7%. Entrepreneurial (family farm) income per family AWU has fallen by 23% in Belgium over the previous five-year average but it has risen by 1% in the Netherlands. While family farm income in Finland fell by 70% in 2015 compared to the previous 5 years, it rose by 3% in Sweden.
Differences in the composition of output go some way to explaining these very different farm income outcomes. However, using the EAA data it is not possible to disaggregate farm income trends by the principal farming systems. To do this requires the use of the FADN farm survey data, but here there are longer delays before publication. The 2013 data were published in January of this year, so this is not a useful indicator to follow current trends in income by farming system (Hill’s study for the European Parliament provides a detailed summary of trends over the period 2004-2012).
The FADN team has developed a milk gross margin index tool which is used to predict the development of the EU dairy gross margin (which is a useful proxy for farm income) for more recent time periods. This is published and updated on the EU Milk Market Observatory. Data for the third quarter in 2015 were published at the end of November 2015 (i.e. with a two-month lag) but the index has not been further updated in February/March despite its great relevance to the current situation on the EU milk market. (I last looked at trends in this dairy gross margin index in a post last September).
Among the decisions taken at the March 2016 Agricultural Council was one to set up a similar Meat Market Observatory, covering beef and pigmeat. The FADN team should be encouraged to develop similar gross margin index tools for these enterprises as part of this exercise (although the difficulties of doing this for beef, given the many very different beef production systems in Europe, should not be underestimated).
Conclusions
This review of recent farm income trends shows the complexity of trying to address farm income as a policy objective at the EU level. At the EU level, averaging over member states and farming systems, EU farm income has proven remarkably resilient to recent market shocks. Although all indicators agree that farm income fell in 2015, the average level of farm income in 2015 was close to the average level in previous years.
However, looking only at the EU averages hides the very disparate trends across member states and farming systems. Unfortunately, we can say little about recent income developments in different farming systems, apart from milk, because of a lack of up-to-date data. Data are available by member state, where four countries stand out – Finland, Germany, Denmark and Slovakia – because 2015 family farm incomes are more than 50% below the previous five-year average. For another three countries – Luxembourg, United Kingdom and (almost) Austria – family farm incomes in 2015 are more than 20% below the average for the previous five years.
Where farm income problems are predominantly located in specific member states rather than the EU as a whole, it seems clear that, if policy intervention is required, this is better taken by the individual member states rather than by the EU as a whole. This is the rationale behind the decision at the March 2016 Agricultural Council to allow a temporary acceptance of state aid that would allow member states to provide a maximum of €15,000 per farmer per year and to eliminate the overall national ceilings on the amount of aid that can be given.
This post was written by Alan Matthews

