
Later this week Agriregionieuropa, the Italian on-line review of agricultural economics and policy, together with the Groupe de Bruges will organize a half-day seminar on “The CAP and the EU Budget” in Ancona, Italy, details here.
Franco Sotte, one of the contributors to this seminar, has produced an interesting analysis of CAP budget expenditure to be presented at an EAAE seminar on ‘Evidence-based Agricultural and Rural Policy Making’ which also takes place in Ancona following the budget seminar.
Sotte’s starting point is that much discussion of the CAP budget is based on proposed expenditure as set out in the multiannual financial framework, but that actual expenditure, as revealed in the EU’s Financial Reports on budget spending, can tell a different story. He notes a number of reasons why expenditure trends in these two series can differ:
- Appropriations for commitments differ from appropriations for payments because it can take time for planned expenditure to actually take place. This affects most EU budget headings apart from CAP Pillar 1 payments where committed expenditure is paid almost immediately to the beneficiaries. As a result, the share of the CAP in appropriations for payment tends to be larger than in commitment appropriations.
- Payments made to Member States can differ from expenditure appropriated for payment particularly in the structural policies (cohesion and Pillar 2 of the CAP) for a variety of reasons. Member States may be unable to come up with sufficient co-financing to draw down funds made available to them. Intended beneficiaries may be unable or unwilling to proceed with approved projects because of difficulties in getting bank credit or for personal reasons. Commission auditing of Member State expenditure may disallow some of it as not complying with the relevant regulations.
- Even the mere fact of the delay between appropriation commitments and final payment to Member States means there is a loss due inflation in the value of the funds transferred. Again, this does not affect CAP Pillar 1 transfer payments where disbursement is virtually immediate.
- A final adjustment is that, in calculating proportions, he nets out administrative expenditure from the overall EU budget (around 6-7% of the total), as administration is a charge equally on all EU expenditure programmes.
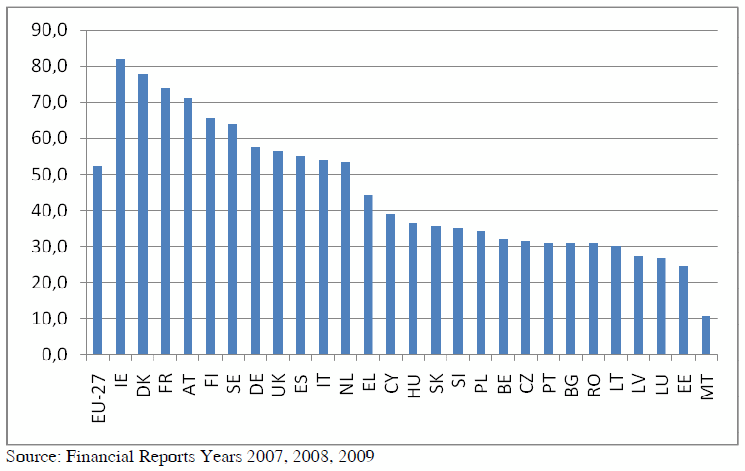
Looking at the importance of the CAP in ex-post payments suggests that its share is closer to 50% of the overall EU budget rather than the 40% more usually assumed. This share differs greatly across Member States. For example, for northern Europe the share is 65% but for the new Member States it is only half this, 32%. The figures for individual Member States are shown in Figure 1. Clearly, the importance of CAP receipts in total EU budget transfers varies greatly by Member State.
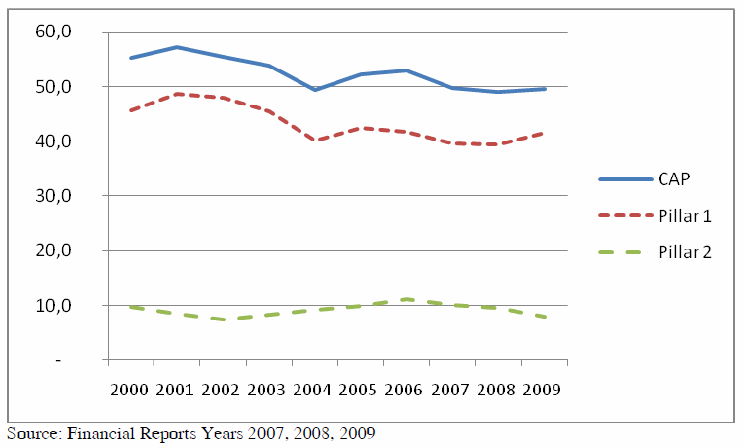
A second feature highlighted by Sotte is that, instead of the presumed ratio between Pillar 1 and Pillar 2 expenditure of 3:1, in payment terms the ratio is more like 5:1. The trend over time is shown in Figure 2. There is a clear cyclical pattern to Pillar 2 expenditure reflecting the rhythm of the programming periods. Again, there are substantial differences in the ratio at Member State level. While the shares between Pillar 1 and Pillar 2 in the new Member States are roughly equal (56:44), the shares are 87:13 in the old Member States. Further disparities are evident within the old Member States. While countries like Finland, Austria and Portugal get more than 40% of their CAP payments as Pillar 2 payments, it is less than 10% in countries such as France, the UK, Netherlands and Denmark.
He also highlights that, despite modulation, the shares of Pillar 1 and Pillar 2 in total CAP expenditure appear to have changed little since the 2003 Fischler reform.
These figures no doubt help to explain the negotiating position of Member States on the future CAP.
Note that the Ancona seminar “The CAP and the EU budget” will be webstreamed in both English and Italian and can be watched at this URL after February 16th.
