We are pleased to bring you this guest post by Dr Alessandra Kirsch who recently completed her PhD thesis Politique agricole commune, aides directes à l’agriculture et environnement : Analyse en France, en Allemagne et au Royaume-Uni at the Université de Bourgogne Franche-Comté. Dr Kirsch did her research at the CESAER, INRA DIJON, France, under the guidance of Professor Jean-Christophe Kroll and Dr Aurélie Trouvé. Her work was financed by the French Ministry of Agriculture.
The evolution of the Common Agricultural Policy shows an increasing emphasis on environmental objectives since their first appearance in the Maastricht treaty in 1992. The research presented here was stimulated by an important contradiction in public discourse. On the one hand, you can read in a booklet on the CAP prepared by the European Commission that “It is only fair that farmers be rewarded by the CAP for providing us with this valuable public good. Income support payments from the CAP are increasingly used by farmers to adopt environmentally sustainable farming methods” (emphasis added). On the other hand, the European Court of Auditors found in a report in 2011 that the single payment scheme, which represent the bulk of direct payments, cannot be linked to the farm environmental impacts. How to decide which point of view is the correct one?
Linking direct payments distribution and farm environmental impacts
To answer this question, we wanted to develop a method which would allow us to rank farms, within their own type of farming, with respect to their environmental impact. We finally decided on an innovative empirical approach based on agri-environmental indicators. We chose to use FADN data because these are the only data which exist in each Member State, and which are available for every year.
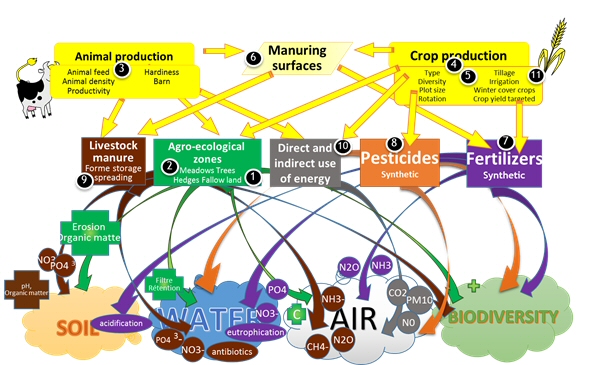
To rank farms on their environmental impacts, we considered the way they operate. We did our best to take into account as many farming practices as we could, given the somewhat limited data available in the FADN. First, we took four environmental elements – soil, water, air and biodiversity – and mapped out how the different agricultural practices were impacting those elements (see figure below).
In fact, there are several impacts for each element, and every decision that a farmer makes has lots of direct and indirect impacts on the environment. This is why it is hard to calculate precisely the whole farm environmental impact with quantifiable measures.

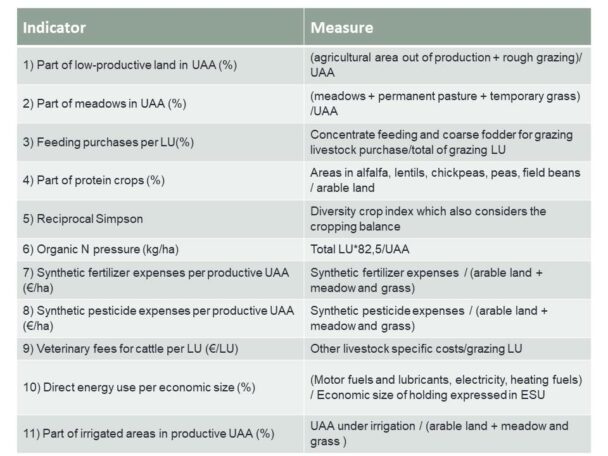
With the FADN data, it is not possible to use status indicators (for example, the quantity of pesticides in the water), so we had to use pressure indicators (pesticide consumption per hectare). It implies that our assessment is not as precise as a field study, but it allows us to rank farms. The list of indicators used in the study is shown in the following table.

For each farm, in its own type of farming, we calculate the value of each indicator. This value gives a rank to the farm, a position in one of the ten deciles defined by the indicator calculation. This position in the decile determines the points granted to the farm, for each indicator, and we add the points gained by the farm, for each indicator.

At the end, we group farms into quartiles, according to these sums of calculated points.

So in fact, our method cannot assess the absolute environmental impact of one chosen farm, but it was not the goal of the study. In view of the number of farms contained in the FADN and with this relative ranking method, we can be sure that farms that are classified in the “best” group (class 4) do have a better impact on the environment than the ones that are in the “worst” group (class 1).
Are direct payments really dedicated to support the more environmental friendly farms ?
The findings consider the two extreme classes, according to the quartiles defined by the sum of points. We analyse the significance of the direct payments amounts received per hectare, from the first and the second pillar. It is important to recall that the payments distribution depends on the choices made in 2003 when decoupling aid from production:
- – The historical model keeps a link with the previous level of intensification of farming : if the farm had a high level of production per hectare, it had high partially-coupled payments under the MacSharry reform. This gives it high amounts of SPS per hectare, and therefore high levels of 1st pillar payments per hectare.
- – The regional (harmonization) model of direct payments does not depend on the farm’s own characteristics: everyone is given the same amount per hectare.
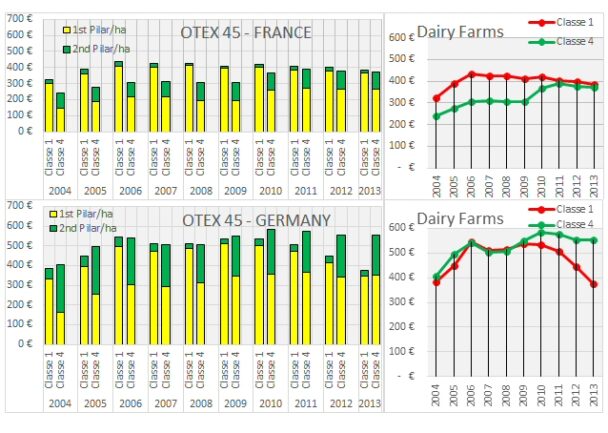
In the graphics below, for each year, the left column represents the average amounts per hectare received by class 1 (which represents the less environmental friendly farms), and the right column represents the average amounts received by class 4 (which are the most environmental friendly farms), as always considered by their type of farming. On the top is shown the French dairy case: France chose the historical model of decoupling. On average, the less environmental friendly farms receive large amounts from the 1st pillar aid, compared to those of class 4. Although class 4 receives more second pillar payments, all in all, they received less payment per hectare. In 2008, a CAP reform redistributed a part of decoupled payments from cereals to grass, and farms of class 4, which grew more grass, received a little more of the SPS payment, reducing the gap.

A different pattern is observed in Germany, which chose a progressive harmonization of decoupled payments, so the level of first pillar payments is progressively becoming the same for both classes. In this case, as in France, the group of the more environmental friendly dairy farms also receive more from the second pillar payments than the others, and now, they also receive more direct aid per hectare in total.
Relationship between environmental and economic performance
Another important finding from this thesis, especially in the current economic conditions of agriculture, is that the group of the most environmental friendly farms is more resilient in case of crises. These types of farms take less advantage of a rise in market prices, but the reductions in their income are much less important in case of crisis. This is illustrated by the graphics below, for French dairy farms.
We draw the following conclusions from our study. In the EU, environmental friendly farms do not get the same support.
First, it depends on the choices made by the Member State in 2003. The historical model tends to maintain payments related to the previous intensification model of the farm and gives larger amounts of SPS payments per hectare to the less environmental friendly farms. In contrast, the regionalisation model gives everyone the same support per hectare.
Second, the co-financing of the 2nd pillar measures imply inequalities linked to the capability and the willingness of Regions and/or Member States to support an environmental friendly agriculture. In the case of France, on average, the amounts of 2nd pillar payments are not large enough to fill the gap induced by the difference of the 1st pillar payments. And even in a country like Germany where the SPS payments are almost the same for everyone, the amounts of the 2nd pillar aids per hectare are very different from one Land (State) to another.
Third, it depends on the type of farming: results are different between cereals/oilseeds farms and cattle farms, for example, and it is still linked to the country. Thus, in France, there is not a big difference in the amounts received on average per hectare for cereals producers between class 1 and class 4 farms, while there is a big disparity for those in the UK.
These findings bring many questions, and we cannot answer all of them here. But we can at least ask this one: is the unity of CAP per hectare direct payments really adapted? Without any link to the way they are producing, or to the income they get, or to the employment they offer, the more hectares a farm has, the more they get in subsidies. Thus, a better income is guaranteed for the biggest farms even before they have sowed. This can allow them to make more environmental efforts, because there is less risk. We particularly could observe that for cereal producers, on average, farms of class 4 had at least 20 hectares of UAA more than class 1 farms, for each country studied (in 2013). And the gap is much more important for UK farmers, if we consider UAA/AWU: it amounts to more than 100 hectares, while the difference remains less than 10 hectares/AWU in France and Germany.
This post was written by Alessandra Kirsch
Photo credit: Ian Britton used under Creative Commons Licence.


