Later this week (7-8 February), the European Council will meet for a second time to try to agree the parameters for the EU’s Multi-annual Financial Framework (MFF) for the 2014-2020 period. The prospects for success remain uncertain; tomorrow I will review the main outstanding issues and the likely flashpoints when the Heads of State and Government meet.
The purpose of this post is to present the numbers as published in successive drafts of the MFF since the Commission’s original proposal in June 2011 and a comparison with the numbers in the 2007-2013 MFF. This provides the context to evaluate the blueprint which European Council President Herman van Rompuy will put before the leaders and any potential agreement.
The main steps since the original June 2011 proposal have been the Commission’s amended proposal in July 2012 to take account of new legislative commitments entered into after June 2011, the proposed accession of Croatia in July 2013, and revised national and regional GNI figures which imply a recalculation of cohesion fund entitlements especially for those member states subject to capping; the Cyprus Presidency’s draft negotiating box in October 2012 which presented revised figures for the first time; and the two proposals for draft European Council conclusions made by Herman van Rompuy (HvR-I and Hvr-II) before and during the last European Council meeting in November 2012.
How the numbers are put together
Presenting a consistent series of MFF numbers over this period is not straightforward for a number of reasons. First, the Commission proposed spending both inside and outside the MFF and some outside MFF expenditure items have been moved inside the MFF in subsequent stages. Both outside and inside MFF expenditure should be tracked to understand the full cost of the EU budget.
Second, not only have some items been reported differently inside or outside the MFF in successive MFF drafts, but individual items such as the Connecting Europe facility have also been reported under different sub-headings in different drafts, so some adjustment of the individual headings is necessary to calculate meaningful percentage changes within headings between the drafts.
Third, for the baseline CAP numbers in the MFF 2007-13 period, it makes a difference whether we use the original numbers entered into the MFF for Heading 2a market-related expenditure and direct payments (that is, the EAGF budget) and, by implication, the amounts available for Pillar 2, or whether we take account of compulsory modulation during the period, which reduces the net amount available to the EAGF and increases the Pillar 2 amount. As this is the basis for the Commission’s MFF proposal for the 2014-20 period, we use the latter figures in the spreadsheet.
Fourth, the numbers are based on published information but sometimes there are gaps in the published numbers which I have completed with my own estimates. To my knowledge, this is the first time a consistent series of numbers for successive drafts of total EU spending has been published (though see also this IEEP Policy Brief following the last European Council meeting for a similar exercise).
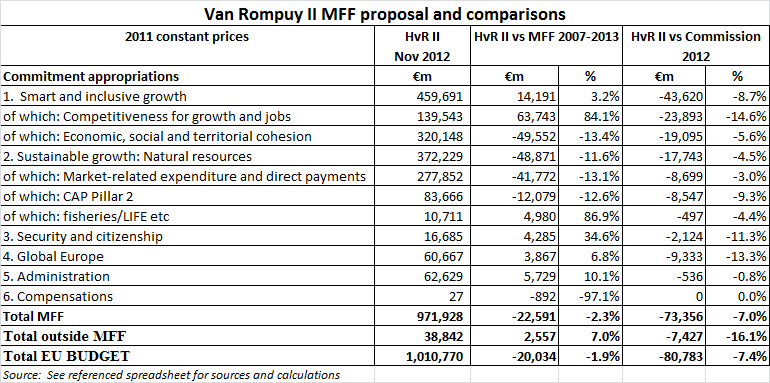
The full spreadsheet, together with sources and assumptions, can be downloaded from here (the spreadsheet itself is stored on Google Drive; the Excel spreadsheet can be downloaded by clicking on File, Download in the menu, ignore any red Download icon that may appear). The main headline numbers are summarised in the table below.

Impact of last van Rompuy draft MFF proposal
Overall, the HvR-II proposal would cut €80 billion from the Commission’s 2012 amended proposal (which is the appropriate comparison because both figures refer to a budget for EU-28), or a reduction of 7.4%.
In terms of the composition of spending, those areas where member states have a guaranteed allocation (CAP and cohesion spending) have been cut less than those areas where future returns to member states are uncertain (competitiveness) or absent (Global Europe).
A further point is that CAP Pillar 1 spending (including the agricultural crisis reserve) is reduced by van Rompuy compared to the Commission’s 2012 proposal by the smallest proportion of any heading (-3%) apart from administration. This is a remarkable outcome if a depressing one, given the public finance and more general economic crises in Europe and the totally untargeted nature of most of this spending.
If the comparison is made instead with spending in the current 2007-2013 MFF, the total EU budget proposed in HvR-II is €20 billion less than the current MFF total in real terms, as was emphasised by Budget Commissioner Lewandowski in an address following the failure of the last European Council meeting.
A rather different picture emerges in terms of the composition of spending when the current MFF is used as the base. The HvR-II proposal would still see a very significant increase, almost a doubling, of spending on competitiveness. Cohesion and CAP spending would fall by equal percentage amounts, and by greater percentages than the EU budget as a whole. This implies some relative shift in resources towards other budget headings in the new MFF.
Significantly, the reduction in Pillar 2 spending is fractionally less than the reduction in Pillar 1 spending when the comparison is with the 2007-2013 MFF.
Thus, when it comes to evaluating what happens to agricultural spending in the new MFF, it makes a difference whether we focus on the changes relative to the Commission’s 2012 proposal or to spending in the current MFF.
Making the comparison with 2013 MFF commitments instead
However, the latter comparison is complicated by the fact that agricultural spending in the new member states was only gradually being phased in over this period. On the other hand, because direct payments which are the largest element in CAP expenditure are fixed in nominal terms, CAP commitment appropriations in real terms were on a declining path in the current MFF.
An alternative metric to use in evaluating the agreed CAP budget is either to compare 2020 spending with 2013 spending (in the same constant prices) as was done in this European Parliament note, or to compare the proposed 2014-20 MFF spending with 2013 spending multiplied by 7 (to represent total spending over the MFF period assuming no change in the CAP budget from 2013 levels). Because not all published versions of the draft MFF’s contain an annual breakdown, only the second comparison is possible and this is shown in the table below.

This table shows that the reduction in CAP spending in HvR-II, when 2013 is taken as the reference point, is smaller than when the full 2007-2013 MFF is taken as the reference. Overall, HvR_II proposed a 10% reduction in CAP spending as compared to 2013 levels. However, now there is almost twice as big a percentage reduction in Pillar 2 as for Pillar 1.
It might be argued that the the overall reduction is slightly bigger because direct payments are still being phased in for Bulgaria and Romania and the accession of Croatia must also be financed within these numbers. On the other hand, some items such as sanitary and veterinary measures and food aid for the needy will be moved out of the CAP budget in the next MFF, and there is also more money for agricultural research in the Heading 1 competitiveness budget.
It is hoped these numbers will be useful in providing the necessary context to evaluate the next draft of the Council conclusions which Herman van Rompuy will put to the European leaders later this week and any potential agreement emerging from that meeting.
Photo credit Www.investmentinsider.eu

Europe's common agricultural policy is broken – let's fix it!

