

Let me welcome you to the first blog post on capreform.eu since I last posted in July. The long absence was due to two reasons. First, the blog was hacked which prevented me from accessing the back end where I construct the posts. And second, a series of commitments over the summer and autumn meant that I did not have the time (or skills) to work out how to regain access to the blog. Fortunately, the blog posts themselves remained available for those who wanted to read them.
I have now found a way around the block. The site will need a bit more work to fully stabilise it and secure it against future hacking attempts but at least I am able to post again. And for this first post after the enforced break I thought to look at what the recent publication of the Agricultural Census 2020 results on the Eurostat website can tell us about the changing structure of EU agriculture.
In this post, I look at the changing number of EU holdings over time. This has been an issue close to the heart of the Commissioner for Agriculture Janusz Wojciechowski who has frequently raised the issue of the declining number of farms, most recently in his opening remarks to the DG AGRI Agricultural Outlook conference on Thursday this week. Are we losing farms at a faster rate than before? As we will see, this is not an easy question to answer.
Clarifying statistical pitfalls before we begin
The Eurostat data now make it possible to track changes in the number of holdings over the 15 year period 2005 to 2020 for the EU27. As with any time series data, it is important to be aware of the potential for definitional changes to influence the trend in the series. The most critical issue is how the statistical population of agricultural holdings is defined, which is described in the metadata for the Eurostat farm structure (ef) domain. Particularly changes in the minimum size threshold to be deemed an agricultural holding can influence the trend.
The definition of an agricultural holding changed three times over the period 2005-2020. The 2005 and 2007 surveys were conducted under Regulation (EEC) No 571/88. The basic rule was that the survey should cover all agricultural holdings of one hectare or more. Smaller holdings could be included if they had significant agricultural activity. Member States could also set a higher minimum threshold provided this threshold excluded only the smallest holdings which together contributed 1% or less to the total standard gross margin.
The surveys in 2010, 2013 and 2016 were conducted under Regulation (EC) No 1166/2008. This retained the basic rule that the survey should cover all agricultural holdings of one hectare or more, but specified that smaller holdings must be included if they had agricultural activity above limits set down in an annex. In addition, the minimum threshold for Member States was raised such that it should exclude only the smallest agricultural holdings which together contribute 2% or less to the total UAA excluding common land and 2% or less to the total number of farm livestock units (LSU). Further country-specific adjustments to the thresholds were made for several countries in 2013.
In 2020, the data covered the agricultural holdings and common land agricultural units that met at least one of the physical thresholds set in Annex II of Regulation (EU) 2018/1091 with regard to the size of agricultural land or the number of livestock units. There was thus no longer a specific requirement to cover all agricultural holdings above 1 ha in size. The minimum size threshold for UAA was set to 5 ha. However, farms smaller than 5 ha had to be included if they exceeded other physical thresholds set out in the Annex. Examples include 2 ha of arable land, 0.5 ha of vegetables or potatoes, 0.1 ha of vineyards, or 1.7 livestock units (this is only a selection).
Where those thresholds did not ensure the coverage of at least 98% of the total national UAA (excluding kitchen gardens) and 98% of the total national livestock units (LSU), countries had to extend the frame by establishing lower and/or additional thresholds. By way of exception, where those thresholds covered more than 98% of the national agricultural production (measured by the Standard Output), those countries could establish higher physical or corresponding economic thresholds, but they had to still comply with the 98% minimum UAA and LSU requirements.
The impact of changing minimum size thresholds
Eurostat provided a useful service by examining the impact of the threshold changes between the 1988 legislation (governing the 2005 and 2007 surveys) and the 2008 legislation governing the 2010 and 2013 surveys. For some countries, the changes resulted in a decrease in coverage, for others an increase in coverage, while for others there was no significant change. For some key variables, such as utilised agricultural area or standard output, the changes made little difference because the thresholds essentially ensured full coverage. However, for other variables such as the number of holdings, characteristics related to holders and managers, and labour force figures, changes could be significant.
The Eurostat post reanalysed the data from the 2007 through 2013 surveys for each Member State using a set of common coverage criteria over the period. To give some examples, while apparently, between 2007 and 2010, the number of holdings decreased by 42% in the Czech Republic, in reality the number of holdings only decreased by 4%. In other words, if the same thresholds as in 2010 and 2013 are applied to the previous surveys (FSSs 2003, 2005 and 2007), on average 43.2 % fewer holdings would be covered.
In Germany, while apparently, between 2007 and 2010, the number of holdings decreased by 19%, in reality, the number of holdings decreased only by 6% if comparable thresholds are used. Italy is another country where the change in survey coverage has affected the trends. In 2007 Italy included all holdings with at least 1 ha of UAA or with production or activity reaching certain minimum limits. In 2010, Italy lowered the UAA threshold thus increasing the survey coverage by around 9%. But in 2013, Italy restored the threshold to 1 ha UAA which caused an apparent reduction of 38% in the number of holdings from 1,620,884 to 1,010,328 holdings between 2010 and 2013. However, taking into consideration only the part of the 2010 population which corresponds to the 2013 population, this decrease is reduced to only 11%.
These changes in the statistical population of agricultural holdings following either EU legislation or national decisions mean that great care must be taken to ensure that misleading conclusions are not drawn from trends in farm structure data over time. For some countries, coverage may have increased between two consecutive periods. But the general tendency is for coverage to become more selective, thus implying that some of the observed fall in the number of holdings is due to statistical reasons rather than reflecting a real phenomenon.
Trends in the number of holdings by Member State
The number of holdings in each Member State between the years 2005 and 2020 is shown in the following table. The 2020 Agricultural Census data for Germany had not at the time of writing been uploaded on the Eurostat website but the total number of holdings was sourced from the Census data on the German Statistical Office website. Almost 60% of EU holdings are in the three countries each with over 1 million holdings, Romania, Poland and Italy. Between them, these three countries had 8.46 million holdings in 2005 and 5.32 million holdings in 2020. Despite the large number of holdings in absolute terms in these three countries, the rate of decline in the number of holdings was very similar to that in the EU as a whole. In 2005, these three countries accounted for 60% of the total number of holdings, and in 2020 for 59%. However, we will see in the next table that this apparent stability conceals different rates of change for the three countries individually.
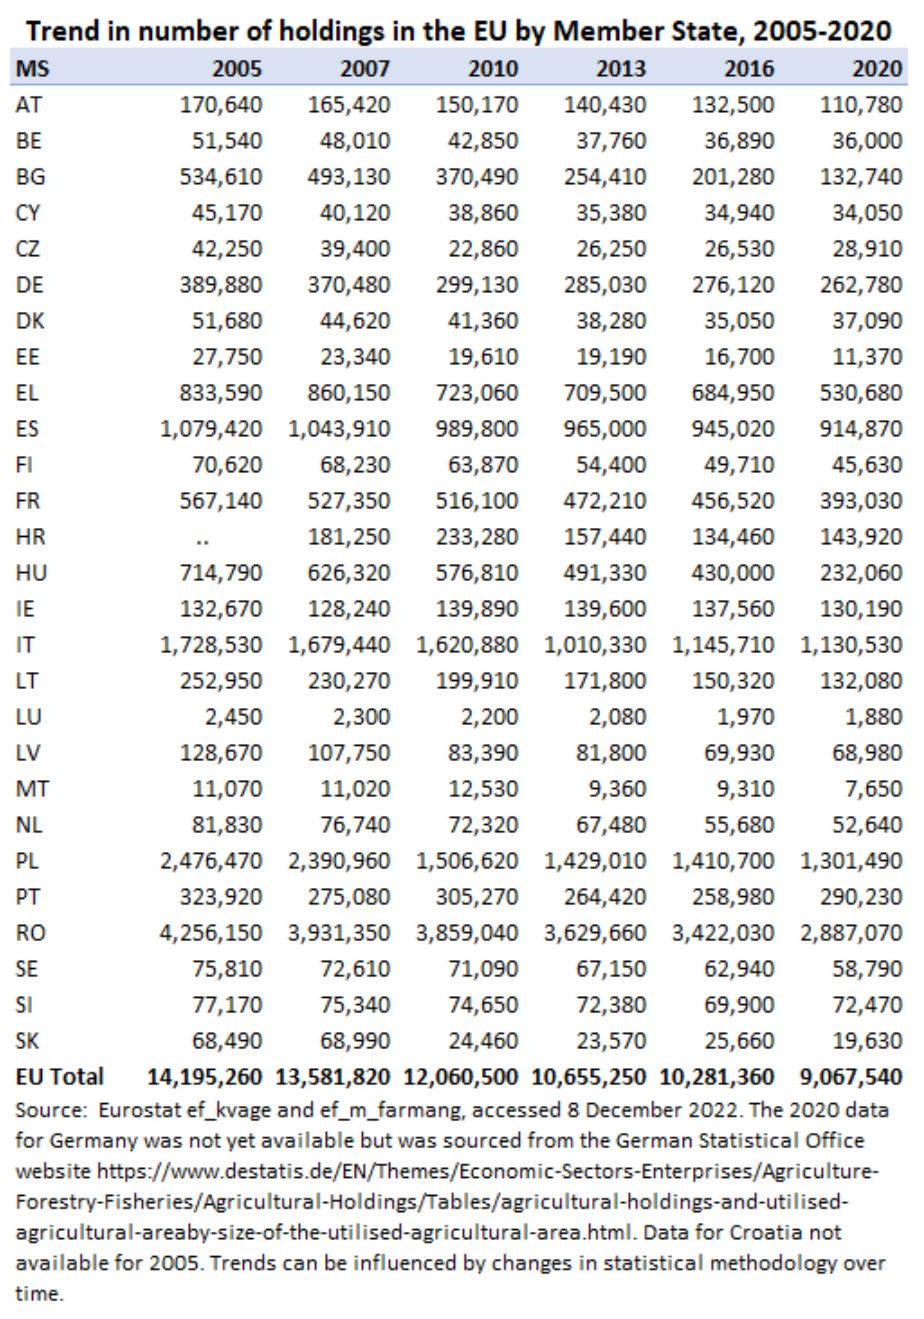
More information on the annual rates of change in the number of holdings in each country is shown in the second table. The final column shows the annual compound rate of change over the whole period 2005-2020. For the EU as a whole, the reported number of holdings has fallen by 2.9% per annum over the period. For the three countries with the largest number of holdings, both Italy and Romania report rates of change below the EU average while Poland reports an above-average rate of change.
In all countries the number of holdings has fallen but at different annual rates over the 2005-2020 period. Ireland (annual rate of change -0.1%), Slovenia (-0.4%) and Portugal (-0.7%) stand out for the relative stability in farm numbers. Bulgaria (-8.9%), followed by Slovakia (-8.0%) and Hungary (-7.2%) show the greatest annual rates of decline over the period. The Baltic countries along with Poland also show above-average annual rates of decline. The restructuring process in many, but not all, of the newer Member States of Central Europe appears to reflect specific characteristics that are not present in other Member States.
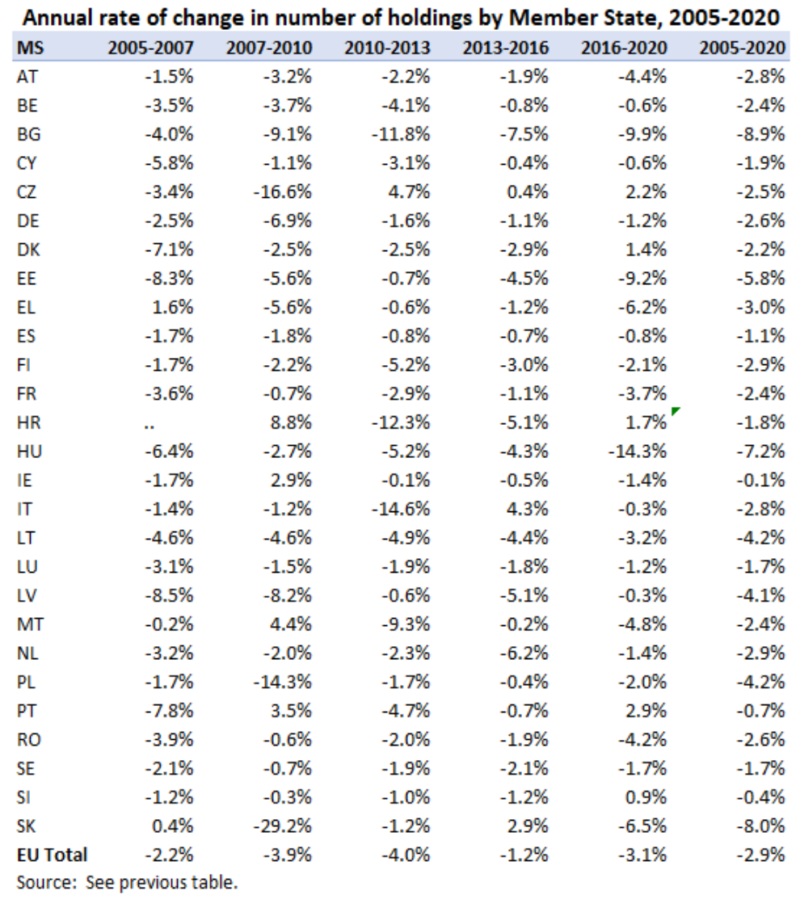
One can also ask if there is evidence that the rate of change is itself changing over time. For example, has the rate of decline in the number of farms been accelerating or slowing down? No clear answer emerges from the previous table, as the intra-period annual rates of change jump around so much (see last row of the table). Clearly, changes in statistical methodology contribute to this variation, as the large Italian annual rate of decline between 2010 and 2013 reflecting changes in methodology discussed above show up in the high EU annual rate of decline in that period. The annual rate of change in the 2016-2020 period was slightly above the EU long-term average, but still lower than two of the previous four periods. We have to remain agnostic as to whether there has been a change in the rate of decline in farm numbers in the recent past.
Conclusions
The fact that farm numbers are falling in the EU should not be conflated with a decline in farming in the EU. A decline in the number of farms in the course of economic development is a stylised fact across all economies. Only in the most developed economies do we begin to observe a stabilisation in numbers due to the growth in the number of very small retirement and hobby farms. It is not impossible that the fundamental economic forces that have driven the consolidation of farms over the last half century could reverse themselves. This would require a dramatic and continuous increase in the real price of food at the farm gate relative to prices of other goods and services, something that cannot be ruled out but which most forecasters consider to be of low probability at the present time.
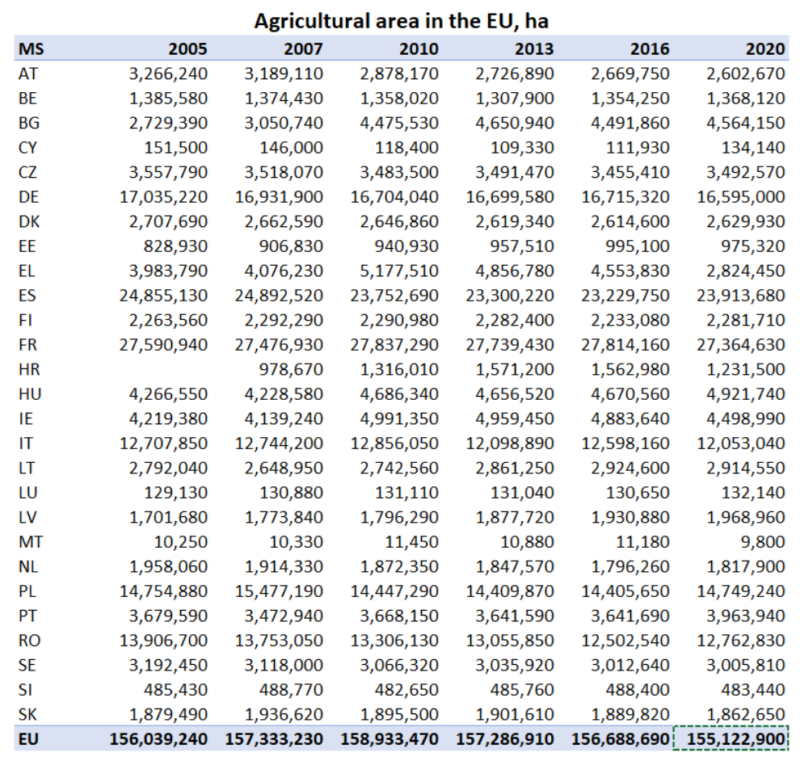
While the number of farms has been declining, the area farmed in the EU has remained broadly stable, although as the Commissioner highlighted in his address to the 2022 Agricultural Outlook conference the 2020 Agricultural Census shows a drop of 3.8 million hectares since the peak in 2010 (see table below, though the Commissioner gave a more cautious estimate of 2 million ha). In principle, these figures should be less likely to be impacted by methodological changes in the statistical population over time given the requirement that the population must cover at least 98% of the agricultural area.
Nonetheless, the fall in the utilised agricultural area in Greece from 4.5 million ha in 2016 to 2.8 million ha in 2020 looks suspiciously like a methodological change. The number of holdings covered also fell (but only by 25% compared to a fall in the agricultural area of 38%), so average farm size fell in Greece during this period (if any Greek reader is able to provide an explanation, it would be great). Greece alone accounts for 2.4 million ha of the (net) 3.8 million ha reduction in the EU agricultural area over that decade.
In any case, we must be cautious in assuming that any reduction can all be attributed to land abandonment or a lack of profitability in farming. Some of this land has been transferred to settlement and infrastructural use but more will have been reallocated to forestry. For example, FAOSTAT statistics (reported in the Eurostat domain for_area) estimate that the area under forestry in the EU increased by 2.6 million hectares in the same period 2010-2020.
The farm structure statistical series is a hugely important source of information on structural trends in agriculture, all of which has great policy relevance. It informs debate not only on farm numbers but also land consolidation, land use, generational renewal, land tenure structure, and the management characteristics of farmers. It is a rich treasure trove of data for further analysis (though further analysis must await the uploading of the German 2020 Census data which is missing at the time of writing this post). Great thanks are due to all those who planned and organised, participated in, contributed to and collated the 2020 Agricultural Census which gives us the most up-to-date snapshot of the structure of European farming.
This post was written by Alan Matthews
Photo credit: Colin Paterson, Yorkshire Dales via Flickr under a Creative Commons licence.
