
Discussions on the future competitiveness of European agriculture often return to the role of capital. Investment in modern equipment, digital technologies, and precision farming systems is widely regarded as essential to sustain productivity growth and to meet new environmental and market challenges. While the Draghi report on EU competitiveness did not directly address the agriculture and food sector, questions are increasingly asked about whether the current pace and composition of investment are adequate, and whether capital is being used efficiently within the sector. These questions are particularly relevant as structural change continues, with a declining labour force and a growing reliance on technological and digital solutions.
The relationship between capital, labour and output in agriculture provides a useful framework for examining these issues. In accounting terms, labour productivity—measured as output per worker—depends both on the amount of capital each worker uses (capital per worker) and on how efficiently that capital is employed (output per unit of capital). Higher investment in machinery and equipment can raise labour productivity if it enables workers to produce more output, but it can also lead to over-capitalisation if output does not increase in proportion to the additional capital used. The direction and efficiency of capital accumulation therefore matter as much as its scale.
A caveat is that, in agriculture, land remains a central determinant of productivity. The amount and quality of land available per worker influence both labour and capital productivity, often more strongly than reproducible capital itself. While the discussion that follows focuses on the relationships between output, labour and capital, we recognise that part of the observed variation in productivity across countries will reflect underlying differences in land endowments and land use intensity.
Against this background, this post examines how capital is being used within EU agriculture and how it relates to overall productivity performance. I make use of a relatively new Eurostat domain in its national accounts database which calculates productivity indicators. The following section looks at recent trends in three key ratios—output per worker (GVA/L), capital per unit of output (K/GVA), and capital per worker (K/L)—to see what insights can be drawn about the role of capital in shaping the competitiveness and structural evolution of European agriculture. We will see that important data issues prevent drawing robust conclusions.
Trends in net capital stock
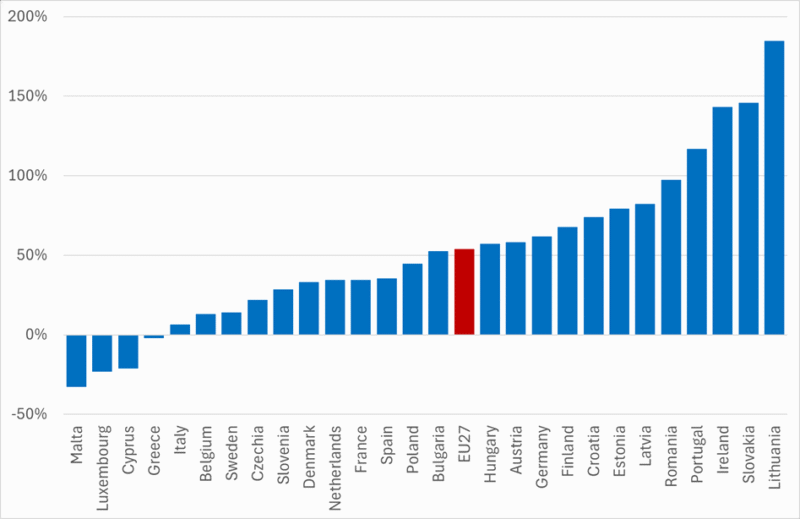
We start by examining the growth in the capital stock. Figure 1 shows the change in the net capital stock in chain-linked volume in the sector ‘Agriculture, forestry and fishing’ (AFF) between 2005 and 2022 (see the data appendix at the end of the post for further explanation, the Eurostat data on productivity are not available for the agriculture sector alone but this is a reasonable proxy as agriculture accounts for 87% of the GVA in the AFF sector). Data for some countries are available up to 2024 but not all, so I have restricted the period to 2005 to 2022.
For the EU27 as a whole, there has been almost no change in the volume of the sector’s capital stock. However, the range of country experiences is extraordinary. Countries to the left of the EU column in Figure 1 have been decapitalising, while countries to the right have been adding to their capital stock over this period. If we arbitrarily draw a line between Belgium and Lithuania, the countries from Lithuania and further to the right in Figure 1 where net investment has been particularly marked are all countries that joined the EU in 2004 or after (except for Luxembourg). Latvia and Croatia have more than trebled their capital stock over this period. There are exceptions. Slovenia increased its capital stock at a much slower pace, while Hungary, Poland and Cyprus have seen a decrease in their capital stock. What explains these very different experiences with respect to capital formation deserves a separate investigation.
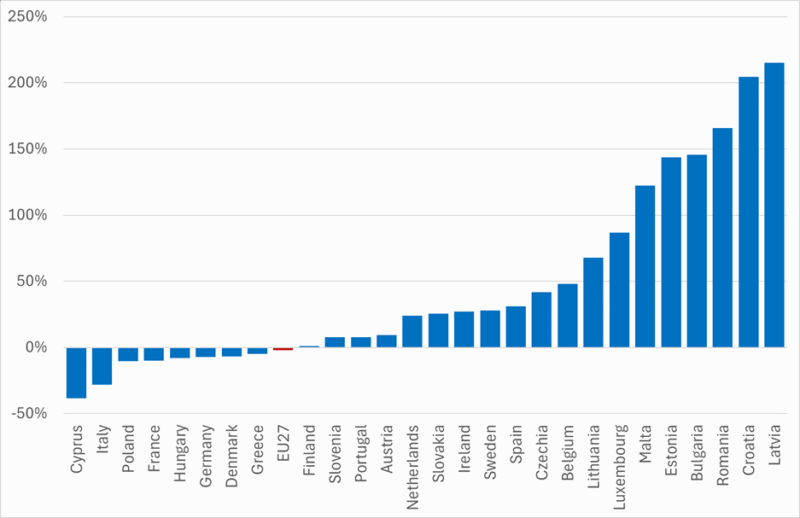
Source: Eurostat, Capital stocks by industry (NACE Rev.2) and detailed asset type [nama_10_nfa_st], chain-linked volumes, 2020 prices.
Trends in gross value added
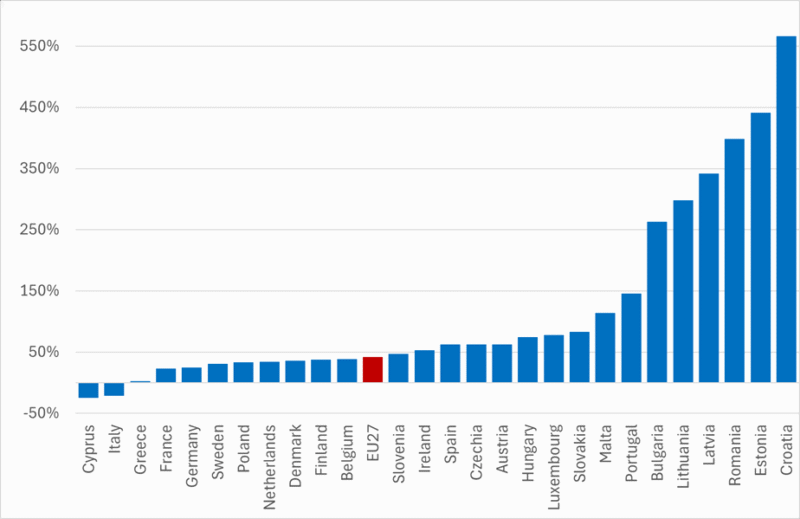
As background to help interpret some of the productivity ratios later, Figure 2 shows the growth in the volume of GVA in the AFF sector over the period from 2005 to 2022. GVA can be volatile from year to year, suggesting caution in looking at changes between single years. Thus, for Figure 2, I have constructed the percentage changes using 3-year averages at the start and end of the period.
Total growth in the EU27 was a rather unimpressive 10% over the 17 year period, but again with very considerable heterogeneity. In one-third of Member States (9/27), the sector contracted, sometimes by considerable amounts (-31% in Cyprus, -12% in Greece, -5% in Italy and -3% in Denmark). At the other extreme, AFF GVA is reported to have more or less doubled over the same period in Ireland and Slovakia.
As I was puzzled over some of the numbers shown, I have added in Figure 2 the growth in the volume of agricultural GVA over the same period based on the Eurostat Economic Accounts for Agriculture (EEA). Some difference is to be expected as the National Accounts data cover the sector ‘Agriculture, forestry and fishing’ while the EEA data refer only to agriculture (the national accounts data also provide the series for agriculture alone and comparing this series to the EAA series shows similar differences). To calculate the volume of GVA, both series use chain-linked volumes and the double deflation method (see data appendix at the end of this post). The national accounts data are chain-linked using 2020 as the reference year, while the EEA data are chain-linked using 2015 as the reference year, which could account for some differences.
While the overall growth in the volume of EU GVA and for some countries is reasonably similar in the two series, there are striking differences for most countries. The most dramatic difference is for Slovakia, which reports almost a doubling (86% increase) in its GVA volume in the National Accounts but a 31% decrease in the EEA! Other countries which show significant divergences include Lithuania (36% as against 157%), Denmark (-3% as against 61%), Ireland (108% as against 53%), Lativa (30% as against 90%), Finland (26% as against 63%), and Poland (1% as against 45%). When we observe such extraordinary differences for estimates of the growth in output for two very similar series, it calls into question how to interpret any productivity growth figures based on these estimates. It is clear the reason for these differences deserves interrogation.
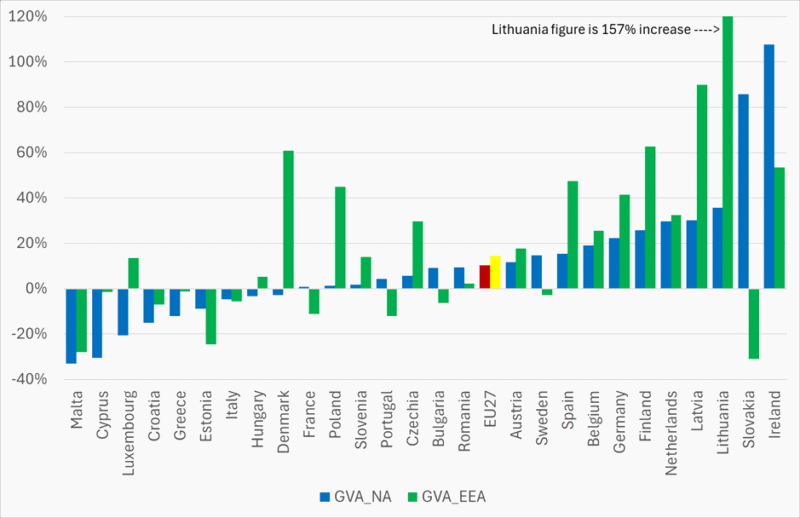
Source: Eurostat, Gross value added and income by main industry (NACE Rev.2 ) [nama_10_a10]: Economic accounts for agriculture – indices (volume, price, values) [aact_eaa05], chain linked volumes, index 2020=100.
Capital productivity and capital intensity of production
Despite these concerns over the interpretation of data, we rely on the Eurostat productivity data using the national accounts figures for the Agriculture, Forestry and Fishing sector in the remainder of this post. Figure 3 shows the capital intensity of AFF production, as measured by the ratio of capital (net capital stock in chain-linked volumes) to AFF output in volume terms (gross value added in chain-linked volumes). Its inverse, the ratio of output to capital, is a measure of capital productivity. We focus on changes in the capital intensity of production by Member State over the period 2005-2022 in Figure 3. For this and subsequent figures, I use the percentage changes between the single years 2025 and 2022.
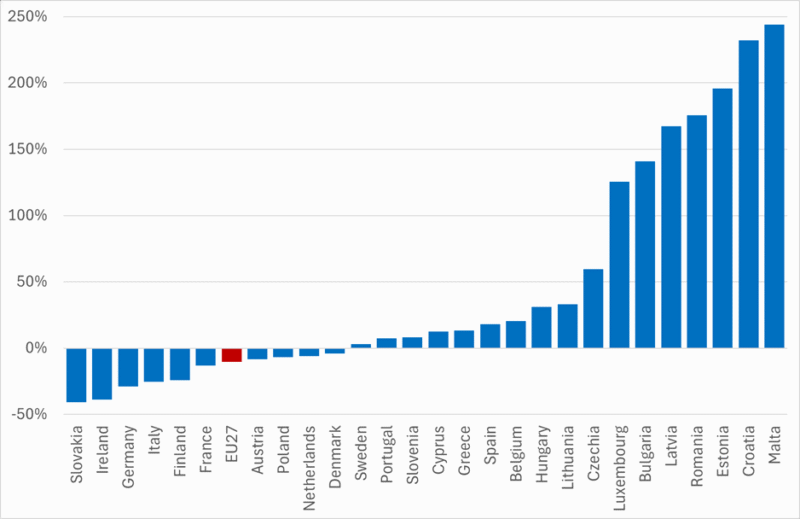
Source: Eurostat, Capital stock-based productivity indicators by industry (NACE Rev.2) [nama_10_cp_a21], index, 2020=10.
Overall, the capital intensity of EU agriculture appears to have fallen slightly, driven by the falls in capital intensity (or, putting it otherwise, increases in capital productivity) in the countries to the left of the Figure. Capital intensity is a ratio, so its trend is influenced both by the growth in the stock of capital (Figure 1) and growth in the volume of output (Figure 2). The big reductions in capital intensity in Slovakia and Ireland are driven by the sharp rise in the volume of output reported in the national accounts, as the capital stock also increased in both countries.
More plausible is the significant increase in the capital intensity of agricultural production in the countries to the right of the figure, which are all countries (except for Luxembourg which has added significantly to its capital stock in the last two decades) that acceded to the EU in 2004 and after. Poland is an important exception where capital intensity has decreased due to a small increase in output accompanied by a slightly greater fall in the capital stock.
Labour productivity
Analogous to capital productivity, we can also calculate a measure of labour productivity, defined as the output (measured as gross value added) in the AFF sector divided by the number of hours worked in the sector (see data appendix at the end of this post for a justification). Figure 4 shows the growth in labour productivity in Member States over the period 2005-2022 and, again, huge heterogeneity is evident. In four countries, the growth in labour productivity has been negative. Each hour spent at work in farming in these countries contributed less in 2022 than it did in 2005, which is a remarkable finding. There are another three countries – Italy, Belgium and Sweden – where the percentage growth over the period is less than 20%, or less than 1% per annum. Those countries to the right of the graph show above-average increases in labour productivity. There is a much less distinctive pattern in the growth of labour productivity between old and new Member States in Figure 4. While new Member States are to be found to the right of the chart, so are countries such as Ireland, Portugal, Finland and Germany, while countries such as Malta, Cyprus, Czechia, Slovenia, Poland and Bulgaria have below EU-average growth in labour productivity.
Source: Eurostat, Labour productivity and unit labour costs by industry (NACE Rev.2) [nama_10_lp_a21]. Real labour productivity per hour worked, index, 2020=100.
As for capital productivity, a change in labour productivity is a ratio which is influenced both by the growth in output (Figure 2) and the change in labour input (measured in hours worked) (Figure 5). The dominant trend is towards a reduction in labour input, but there are three countries – Belgium, Luxembourg and Malta – where labour input increased between 2005 and 2022. There are six countries, all in Central Europe except for Portugal, where labour input fell by 47% or more. The fall in labour input is clearly a major contributor to the increase in labour productivity in the AFF sector shown in Figure 4.

Source: Eurostat, Employment by main industry (NACE Rev.2) – national accounts [nama_10_a10_e]. Total employment domestic concept, index 2015=100 (based on hours worked).
Capital deepening – the capital to labour ratio
Another possible contributor to an increase in labour productivity is an increase in the capital stock per worker. A positive change in the capital-labour ratio is referred to as ‘capital deepening’ and can be an important contributor to increased labour productivity, though more so in industry where land is not as an important factor of production as in agriculture. Trends in the capital-labour ratio are shown in Figure 6.
Source: Eurostat, Capital stock-based productivity indicators by industry (NACE Rev.2) [nama_10_cp_a21]. Net fixed assets per hour worked, index 2020=100.
The general tendency is for workers in the AFF sector to have more capital to work with over time, though Cyprus and Italy are two exceptions. But for the six countries to the right of the graph, all acceding countries to the EU in 2004 and after, the increases are quite dramatic (note the scale on the vertical axis). This reflects both a significant increase in the capital stock (Figure 1) and also a bigger-than-average decrease in labour input (Figure 5). Where capital deepening is a consequence of the outflow of labour, it does not necessarily represent productivity-driven investment. However, as noted, many of these countries have also been adding to their capital stock which is more likely to enhance the productivity of labour.
Relationships between the productivity indicators
Relationship between GVA/L and K/L. To further investigate the possible relationship between increases in the capital-labour ratio and increases in labour productivity in the AFF sector, Figure 7 shows the correlation between the variables. Overall, the figure shows a very weak correlation. Observation suggests that the slightly positive slope is heavily influenced by the Lithuania outlier and, indeed, if this is removed, the trend line becomes almost flat. There is also very large variation around the trend line (captured by the low R2 value of 0.16). That is, countries that experienced similar rates of increase in the capital-labour ratio also had very different growth rates in labour productivity.
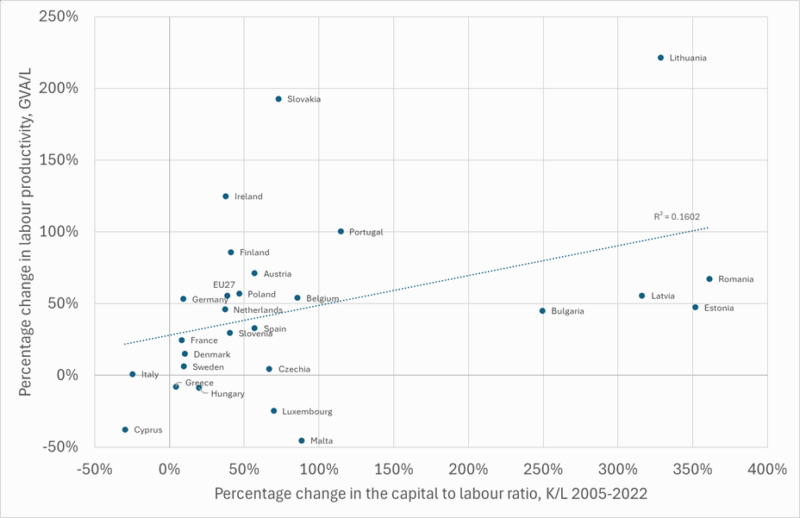
Source: Own construction, based on Eurostat national accounts data described in previous figures.
There is thus limited evidence that more rapid growth in capital per worker is associated with more rapid growth in labour productivity in the AFF sector. This could point to a poor allocation of the additional capital, leading to possible overcapitalisation or poor capital utilisation. It also reflects the fact that labour productivity in the agricultural sector is more influenced by the availability of land per worker, and a more thorough analysis would need to investigate the impact of additional capital per worker holding land endowment constant.
Relationship between K/GVA and K/L. It is also informative to look at the relationship between the capital intensity of production (recall that this is the inverse of the productivity of capital) and the capital-labour ratio (Figure 8). The trend line here has a stronger upward slope with less variation around the trend. The line indicates that countries with a faster rate of increase in the capital-labour ratio also had a faster increase in the capital intensity of production (or a faster decrease in the productivity of capital). This supports the view that there may be diminishing returns as farmers add more capital per worker. However, the relatively low correlation coefficient indicates that other factors are also important in explaining this relationship.
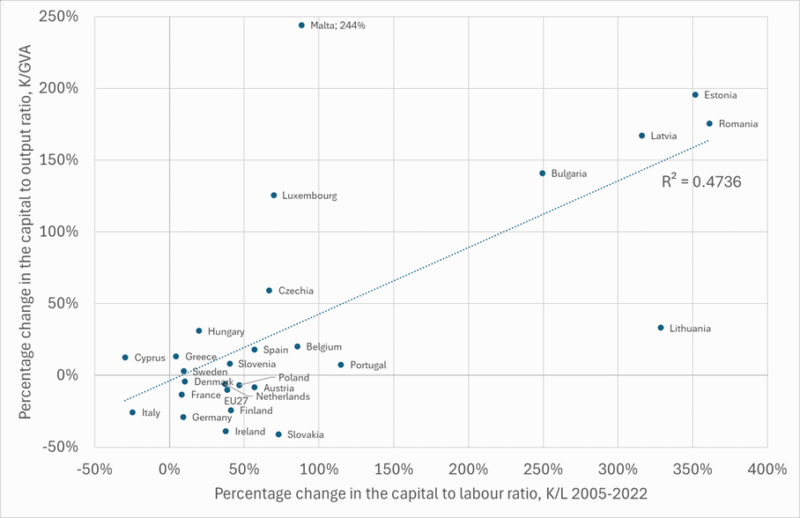
Source: Own construction, based on Eurostat national accounts data described in previous figures.
Further insights are gained if we mentally divide the X-Y graph into four quadrants at the (0,0) point. In the bottom right-hand quadrant are those countries (mostly the older Member States) where the capital-labour ratio has been increasing but the capital intensity of production has been decreasing (capital productivity increasing). These are countries where capital deepening has been efficient in that output per unit of capital has been maintained or improved.
Countries in the upper-right quadrant have experienced both rising capital-output and capital-labour ratios. So there is substitution of capital for labour but without clear productivity gains, possibly reflecting diminishing marginal returns to capital or capital misallocation.
| A major caveat to all the trends discussed in this post is the significant discrepancy in output growth measurements between two official Eurostat sources (see Figure 2). Until these discrepancies are resolved or explained, the specific magnitudes of productivity changes for several Member States, and thus the strength of the relationships drawn, should be interpreted with caution. The overall direction of the trends for the EU27, however, is likely robust. |
Conclusions
This post has examined simple productivity trends in the Agriculture, Forestry and Fishing sector using Eurostat national accounts data over a period of nearly two decades, with a focus on the role of capital. It makes use of the accounting identity that labour productivity, measured as output per worker, depends both on the amount of capital each worker uses (capital per worker) and how efficiently that capital is employed (output per unit of capital).
Data on the change in the capital stock in agriculture show disparate trends. In one-third of EU Member States there is a process of decapitalisation where new investment is less than the depreciation of the previous capital stock. This includes countries like France, Germany and Denmark. It is hard to match these data with stories that farmers are investing in ever-bigger machines, in robotics and in new stables or slurry tanks to meet higher animal welfare or environmental requirements. On the other hand, the data show that many of the new Member States have undertaken massive new investments and have significantly increased their capital stock, but with some evidence that this does not always translate into higher productivity.
We observe a great heterogeneity of growth rates both in the growth of labour productivity over time, growth in the capital-labour ratio and growth in the capital-output ratio. With respect to the growth in labour productivity, there is no real hard and fast distinction between old and new Member States, which will surprise many (it surprised me!). In fact, in four countries labour productivity has fallen over the past two decades.
Labour productivity is an important determinant of income from agriculture (together with subsidy transfers and outgoings for non-owned production factors of land and capital). One would have expected that the new Member States, with lower average levels of labour productivity to start with, would be converging on labour productivity levels in the older Member States through more rapid growth. But this expectation does not appear to be supported by these data.
We also conclude that more rapid increases in the ratio of capital to labour are not strongly reflected in more rapid increases in labour productivity. While this may point to inefficiencies in capital allocation, the most plausible explanation is the unobserved role of changes in land per worker and land quality. A more robust analysis would require a multi-factor productivity model that explicitly includes land.
One question is whether it is reasonable to assume that the trends in the AFF sector can be taken as representative for the agricultural sector alone. The use of the AFF sector is because we only have capital stock data for this sector and not for its individual components. But agriculture consistently accounts for about 87% of the GVA in the AFF sector, so there should be a close correlation between movements in the two series.
The bigger question which throws a shadow over all the subsequent analysis is whether we can take the data used in this post at face value, given the dramatic differences revealed in the growth in the volume of output between the national accounts and the economic accounts for agriculture (while one series in Figure 2 measures output in the AFF sector to be consistent with the capital stock measure, and the other output in agriculture alone, the same differences exist if we make the comparison with just the agriculture sector alone in the national accounts data). I am not aware of anyone who has put these two series together before now, so I cannot offer any explanation for these discrepancies. Anyone who has insights is very welcome to share them in the comments.
Data appendix
The data I use is mostly drawn from Eurostat’s labour and capital productivity domain nama_10_lpc described in detail in these metadata. The data are part of an extended dataset that has been published since December 2021 following the work of a Task Force on productivity. The data are derived from the national accounts provided by Member States and are broken down by economic activity. Data are not available for agriculture alone but only for the larger ‘Agriculture, forestry and fishing’ (AFF) sector. Differences in the composition of this sector between EU countries would be expected to bias a comparison of productivity levels in absolute terms. In this note, I am looking only at trends in productivity over time, which should minimise the impact of such composition differences.
We examine the relationship between three variables:
- Gross value added (GVA) in the AFF sector, which is the difference between output at basic prices and intermediate consumption. Note that subsidies not related to production, such as decoupled area payments or environmental or rural subsidies under the CAP, are not included in GVA. GVA is a measure of the economic output generated by the sector itself. GVA is measured using the double deflation method in chain-linked volumes (GVA in prices of the preceding year is expressed as the difference between output measured in prices of the preceding year and intermediate consumption measured in prices of the preceding year), so it is an indicator of the real level of economic activity excluding the impact of inflation.
- Labour input (L) includes both employees and self-employed persons and can be measured either in terms of persons employed or hours worked. The methodology is consistent with the other national accounts variables (for example, the employment figures must be consistent with the compensation of employees data). It thus differs from the employment estimates published by the Labour Force Survey or the Integrated Farm Statistics. The purpose of the national accounts employment estimates is to measure the input of labour to the process of production. Individuals with multiple jobs are recorded only under the industry of their primary activity to prevent double-counting but this can create distortions when looking at productivity trends if the share of part-time workers changes over time. For this reason, Eurostat recommends that productivity measures involving labour should used hours worked rather than persons employed.
- Capital inputs (K) are measured using data on the net capital stock. The net capital stock is the sum of the written-down values of all the fixed assets still in use. It can also be described as the difference between gross capital stock and consumption of fixed capital. Ideally, capital productivity indicators should be calculated using the flow of capital services provided by the productive capital stock, which can be considered analogous to the hours worked measure for labour services. Deriving such a measure requires sophisticated calculations and assumptions and is not currently required of Member States, so the net capital stock is used to approximate this concept. The assumption is that the change in the market value of net capital stocks approximate changes in productive capacity over time (Eurostat). For the purpose of measuring productivity, net capital stocks are calculated in real terms as chain-linked volumes.
This post was written by Alan Matthews
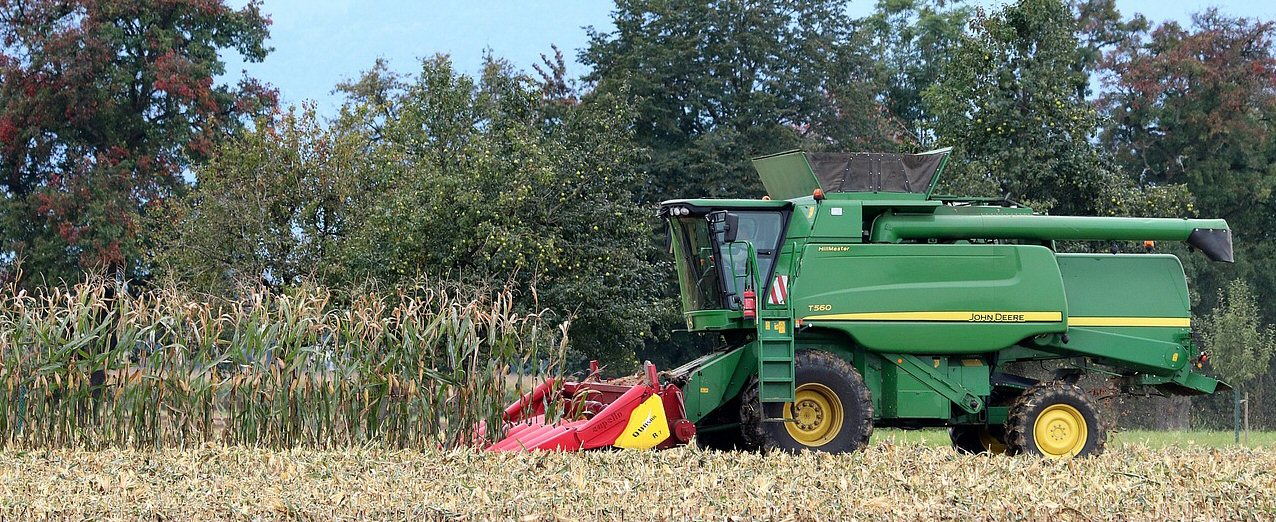
Photo credit: Corn harvest, WFranz via Pixabay and used under a Pixabay licence.
