


Eurostat released its agricultural output and input price index numbers for the second quarter of 2026 in early September. While they only provide updated price developments for the first half of the year, the trends will have a major influence on the farm income outturn for 2026.
Eurostat notes that, in the second quarter of 2026, the average price of agricultural output in the EU fell by 5.8% compared with the second quarter of 2025. This was a third consecutive quarter of decline. The average price of agricultural inputs (goods and services consumed in agriculture and not related to investment, such as energy, fertilisers or feedingstuffs) increased by 4.7% in the second quarter of 2026. This followed a period of relative price stability throughout 2025, into the first quarter of 2026. The trends are shown in Figure 1.
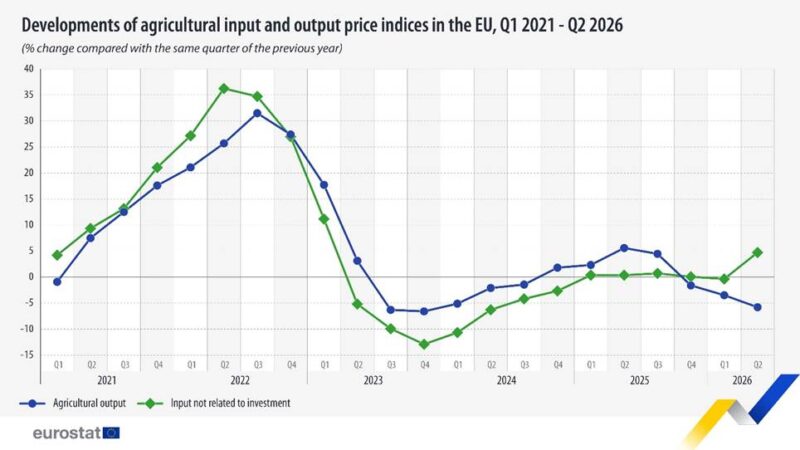
Source: Eurostat, ‘Agricultural output prices fall as input costs rise’, News article 10 September 2026.
We can derive the trend in agriculture’s terms of trade as the ratio of developments in output prices relative to developments in input prices. It is often assumed that an improvement in agriculture’s terms of trade signifies a potential boost to income, and vice versa, but this is not necessarily the case.
In a previous post on this blog, I introduced the concept of the income terms of trade to better capture the impact of changes in relative output and input prices on farm incomes. The rationale for this index is shown in this example. Suppose that both output and input prices increase by 10%. In this case, agriculture’s terms of trade remain stable and do not change. Nonetheless, on the assumption of constant volumes of output and input, farm incomes will also increase by 10% in this scenario.
The explanation lies in the (simplified) identity that total output = total inputs + farm income. Farm income is thus the residual after inputs are subtracted from output. If both outputs and inputs increase by 10%, then so must the residual. An important implication is that farm incomes can continue to increase even when input prices are increasing faster than output prices. This is because the weight of a percentage point change in input prices is only a fraction (given by the input cost share) of the contribution of a percentage point change in output prices to the subsequent change in farm income. The formula for calculating the income terms of trade, which measures the percentage change in farm income arising from the combined effect of output and input price changes, assuming constant volumes, is given by:

Agriculture’s income terms of trade Q1 2020 to Q2 2026
Figure 2 shows the EU-wide change in both agriculture’s terms of trade and the income terms of trade from Q1 2020 to Q2 2026. Agriculture’s terms of trade (the blue line) were deteriorating in the two years prior to the Russian invasion of Ukraine in February 2022 reflecting, in particular, higher energy prices. Contrary to much conventional wisdom, which has focused on the higher cost of energy and fertilisers arising from the Ukraine war, the war introduced a period in which output prices increased faster than input prices, though it was not the only reason for this. This period of relative improvement ended abruptly in Q2 2025 as producer prices notably for cereals and milk lost momentum and input prices stabilised. The further deterioration in 2026 has been driven by both a further decline in output prices but also a sharp increases in input prices in Q2 2026 reflecting the impact of the Iran war and the closure of the Straits of Hormuz.
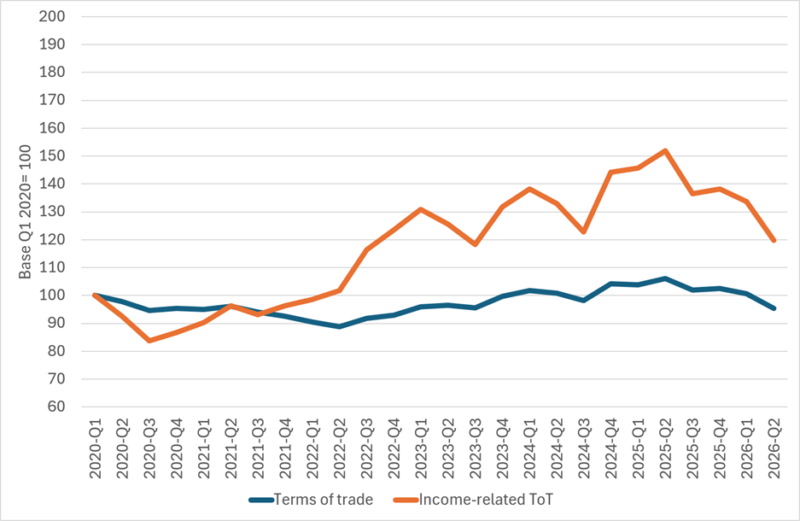
Source: Eurostat, datasets: apri_pi_outq and apri_pi_inq. The income terms of trade are calculated assuming an input share of 63%, calculated from the Eurostat Economic Accounts for Agriculture.
The income terms of trade shown in Figure 2 (brown line) show that the temporal path of the income effect of these relative price changes was both different and amplified in both upward and downward directions. Now, apart from the first three quarters of 2020, relative prices changes have generally contributed positively to income between Q3 2020 and Q2 2025. Also, the income effect of the improvement in the agriculture’s terms of trade is greatly amplified, as are both the peaks and troughs. This amplification effect is due to the residual nature of farm income which reacts more strongly to a given percentage change in either output or input prices.
Specifically, we can note that the impact on income of the adverse movement in agriculture’s terms of trade since Q2 2025 is strongly reinforced. Price movements alone are likely to have led to a reduction in farm income of 20% between Q2 2025 and Q2 2026. Nonetheless, even the relative prices in Q2 2026 will have contributed 20% to farm income compared to their relative level in Q1 2020. The fear is that, with the continued blockage of fuel and natural gas supplies from the Gulf region and with oil and natural gas prices trending higher, this adverse trend will continue into the second half of the year.
A possible offset might be the continued uncertainty on global food markets. Some commentators point to potential harvest impact of the extraordinarily large El Niño effect now gathering pace in the Pacific. Others point to the market effects of the obstacles to Black Sea exports. If countries fear shortages of grains and oilseeds, this could lead to a proliferation of export restrictions which would drive global food prices higher. On the other hand, this analysis by Bayley and Mitchell of the prospects for world food markets is more reassuring, noting in particular that the world is facing into the coming period with relatively high stock levels for major grains.
Commodity examples of the income terms of trade: the case of milk and cereals
An obvious shortcoming of this type of aggregate EU-level analysis is that it does not take account of the specifics of individual countries or individual commodity markets. The experience of an individual country or commodity can deviate strongly from this average EU picture. We thus extend the analysis to examine relative output and input price trends for two major commodities, milk and cereals. For milk, we examine the milk/feed price ratio, and for cereals the cereals/fertiliser price ratio. The results can be seen in Figures 3 and 4. Both price trends and income effects follow different trends to those for agriculture as a whole.
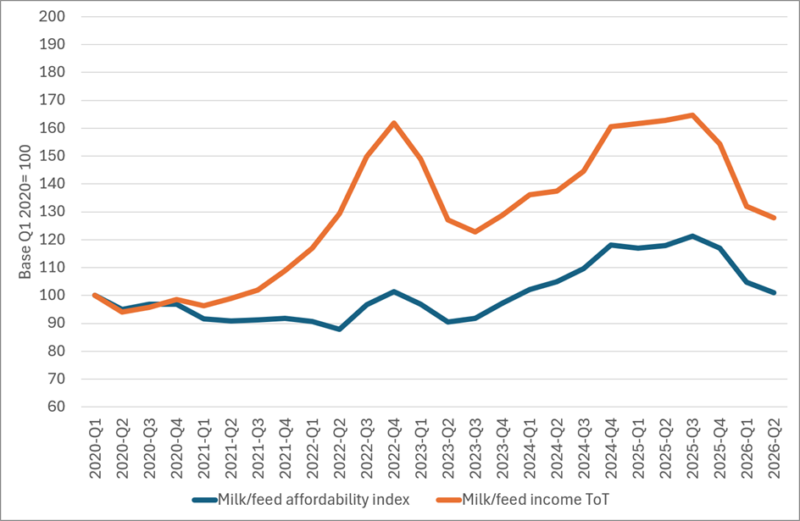
Source: Eurostat, datasets: apri_pi_outq and apri_pi_inq. The income terms of trade are calculated assuming a feed input share of 30% calculated from FSDN data for specialist milk farms. The affordability index can be interpreted as the amount of feed that can be purchased per unit of milk.
The milk/feed affordability index moves against dairy farmers in the first half of the period but then improves in line with the general improvement in agriculture’s terms of trade in the second half of the period until Q3 2025 after which there is again a sharp decline. However, as feed costs only constitute 30% of dairy farm revenues on average, rising relative feed prices in the first half of the period did not prevent a dramatic improvement in the income terms of trade as milk prices also improved during this period. There was a sharp rebalancing in 2023 as global dairy product prices fell back from their record-high prices in 2022, followed by a recovery in the income terms of trade on the back of the favourable trend in the milk/feed affordability index in the second half of the period. Despite the sharp fall in the income terms of trade since Q3 2025, relative price movements of milk and feed contributed to a potential increase of almost 30% in dairy farmer incomes in Q2 2026 compared to Q1 2020. As for agriculture in general, the concern is that the deterioration evident since Q3 2025 will continue into the second half of this year.
The cereals/fertiliser affordability index and income terms of trade are shown in Figure 4. The figure shows the more vulnerable situation of cereal growers compared to other farm sectors in recent years. The affordability index has declined steadily since Q1 2021. This did not prevent an even more dramatic increase in the income terms of trade for cereal growers compared to dairy farmers arising from very favourable cereal prices in the years prior to and in the immediate aftermath of the Russian invasion of Ukraine in Q1 2022, combined with the fact that fertiliser costs make up a relatively small share of cereal grower revenues at 16% (a more complete analysis would also need to take the trends in other input costs into account). But since Q2 2022, the income terms of trade have reversed and have been on an almost continuous decline. Bumper global harvests not least of wheat in Russia, the resumption of Black Sea exports and cooling global demand in response to the previous high prices put downward pressure on cereal prices even while fertiliser prices also steadily retraced from their previous high levels (hence the relative stability in the cereals/fertiliser affordability index in the middle part of the period). Since Q4 2024 a further decline in the affordability index has contributed to a further deterioration in the cereals/fertiliser income terms of trade, which in Q2 2026 was only slightly above its level in Q1 2020. Relative price movements have been less favourable for cereals growers compared to dairy farmers or for the EU agricultural sector in general.
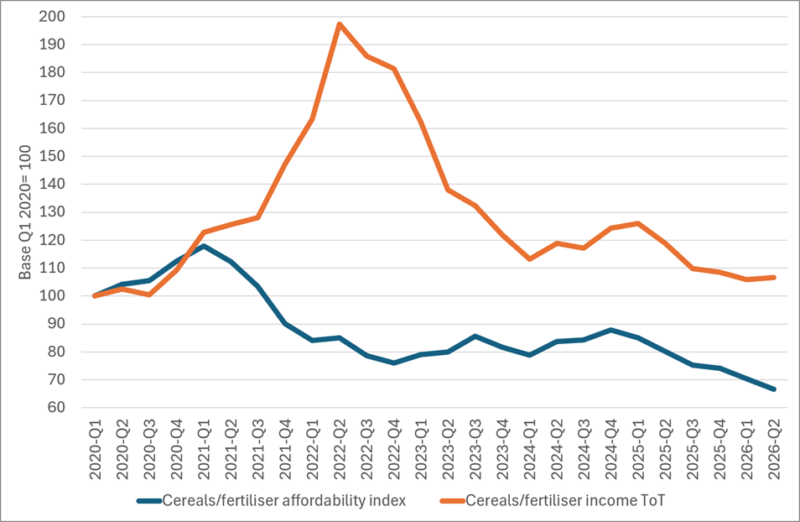
Source: Eurostat, datasets: apri_pi_outq and apri_pi_inq. The income terms of trade are calculated assuming a fertiliser input share of 16% calculated from FSDN data for COP farms. The affordability index can be interpreted as the amount of fertiliser that can be purchased per unit of cereals. The trend in the cereals/fertiliser affordability index shown here differs in amplitude from that shown in the Commission’s Fertiliser Action Plan published in May 2026 (see Graph 1 in that publication). DG AGRI use fertiliser market data obtained from Argus Media Ltd. and S&P Global Commodity Insights. As these are proprietary data sources it is not immediately clear what accounts for the difference with the Eurostat data.
Conclusions
Relative price movements provide an early indicator of the economic health of the farm sector. This blog post shows how movements in agriculture’s terms of trade can be reconstructed to better monitor the income effects of relative price movements. The resulting income terms of trade shows that relative price movements at the EU level and on average across farm enterprises have contributed positively to income over the full period examined here, Q1 2020 to Q2 2026, assuming constant output and input volumes. The example of cereals shows that this is not necessarily the case for all farm enterprises. Nonetheless, there has been a steady deterioration in the income terms of trade for agriculture in the last four quarters since Q2 2025, indicating increasing pressure on farm incomes in recent months.
The actual evolution of farm incomes depends, of course, not only on relative price movements but also on the trends in output and inputs. Particularly the impact of drought has reduced output levels significantly for particular sectors in several EU Member States this summer. DG AGRI’s Summer 2026 short-term market outlook published in July 2026 took a relatively benign view of output trends. It concluded that EU production remained robust, with increased production expected for oilseeds, dairy, pigmeat and poultry, cereal production remaining close to its five-year average, but some reduction expected in ruminants, sugar and olive oil sectors. Since then, the latest JRC MARS crop monitoring bulletin published at the end of August reports that, while yield prospects for most winter cereals have been confirmed at around the five-year average at EU level, yield prospects for summer crops have been sharply reduced, falling below the five-year average by up to 14%.
Reduced yields will add to the travails of cereal growers already feeling the pressure of declining income terms of trade. There may be some prospect of relief in the recent trends in world grain markets, where prices have risen by around 20% since the beginning of this year (World Bank Commodity Pink Sheet). There remains uncertainty about how future trends will be affected by the current El Niño, restrictions on Black Sea exports, higher fertiliser costs and the possibility of trade restrictions.
This post was written by Alan Matthews.
Photo credit: Downloaded from Geograph © Copyright Michael Trolove and licensed for reuse under this Creative Commons Licence.
