

Eurostat has produced its first estimate of agricultural income in 2017, and it makes interesting reading. Both real agricultural income per Annual Work Unit (called indicator A in Eurostat terminology) as well as real agricultural entrepreneurial income per unpaid Annual Work Unit (Indicator B in Eurostat terminology) reached record levels (see chart below). This is surely something to be welcomed, even if COPA-COGECA did not issue a press release to draw attention to this fact. Across the EU as a whole, income from farming when divided among those working in the industry is in a robust state, even if the regular grumbling from industry representatives sometimes gives the opposite impression.
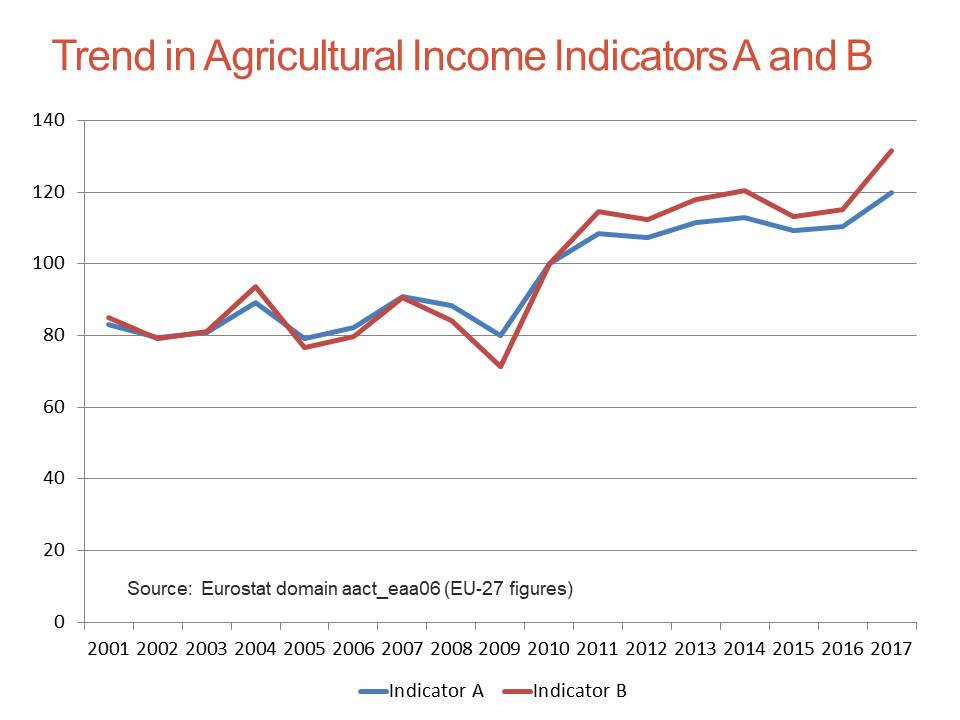
I discussed these income trends in detail this time last year in this post, so today’s post is an update. Just as a reminder, Indicator A corresponds to the real income of factors of production in agriculture, defined as net value added at factor cost, per Annual Work Unit. Indicator B is calculated by deducting the value of paid wages, paid interest and paid land rents from agricultural factor income, divided by unpaid Annual Work Units, and so better represents what we understand as family farm income. In countries where a significant proportion of agricultural production is organised in corporate rather than family farms, this indicator needs to be interpreted with caution (trends over time should still be meaningful even if the use of the absolute values of this Indicator in comparisons would be misleading).
Caveats and qualifications
There are, as usual, four important caveats to be made when looking at the previous chart.
First, the trend in agricultural income must not be confused with the total income of farming households as it does not comprise income from other sources (non-agricultural activities, salaries, social benefits, income from property).
Second, these data are preliminary. They are based on first estimates of the Economic Accounts for Agriculture for 2017 which were forwarded by Member States to Eurostat at the end of November last year. The countries send second estimates for 2017 by the end of January and Eurostat publishes these in March. Final data are sent by the end of September and published in October.
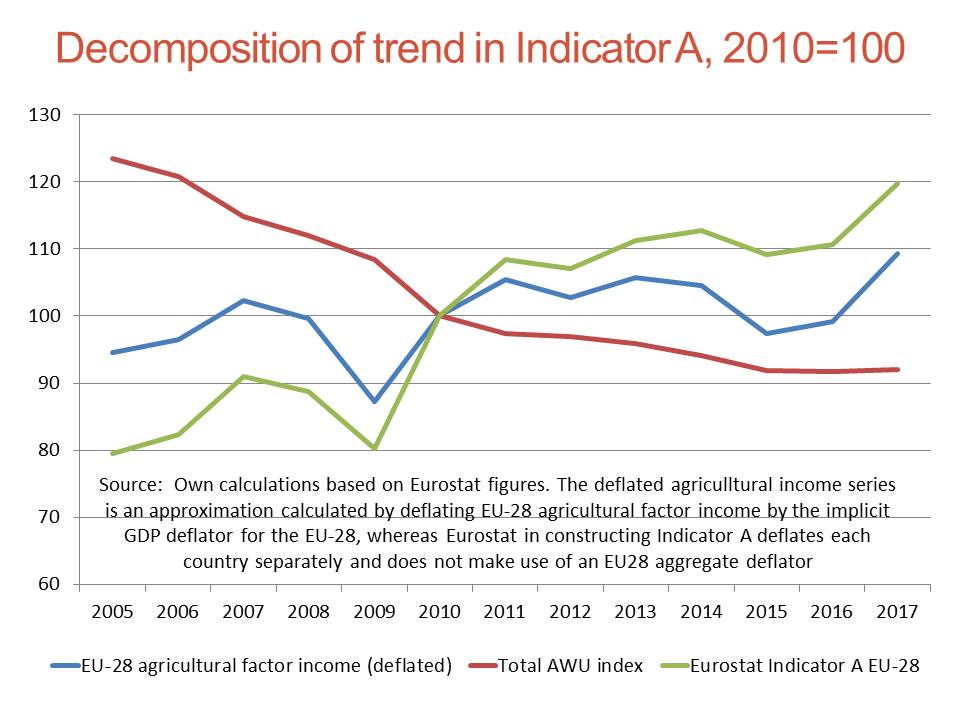
Third, it makes a difference whether the main contribution to the record 2017 figures comes from more buoyant agricultural income (an improvement in the numerator) or from a more rapid exodus of workers out of the industry, perhaps stimulated by improved economic opportunities in the non-farm sector as EU economies recover from the recession caused by the economic crisis in recent years (a change in the denominator).
The following charts show the decomposition for both Indicator A and Indicator B. In fact, the exodus from agriculture has virtually halted in recent years, so that the record agricultural income per worker figures in 2017 are due to a recovery in agricultural income rather than a reduction in the number of workers.

Fourth, these data show averages for the EU-28 as a whole- The figures for individual countries can be very different, and indeed show very considerable variation. The change in real factor income per worker between 2010 and 2017 by Member State is shown in the left-hand panel in the next chart.
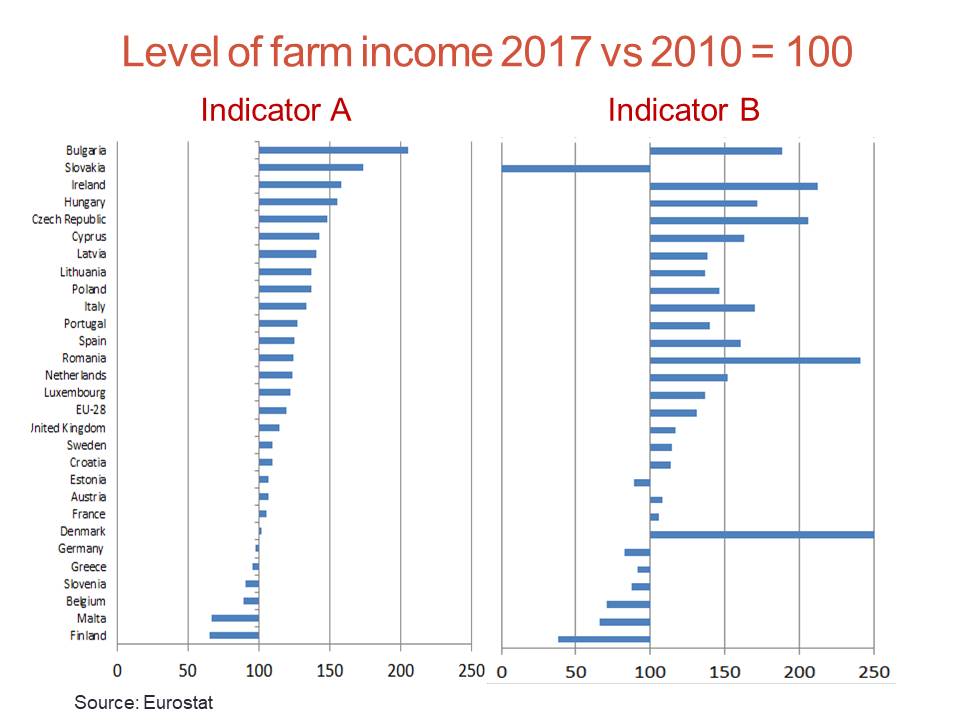
There are six countries shown where agricultural income per worker in 2017 is lower than in 2010 (bear in mind that comparisons between any individual years risk being misleading if the individual years were exceptional for some reason). As well as Finland, Belgium, Greece and Germany, they include two newer Member States, Malta and Slovenia, which would have benefited from the phasing in of direct income support after 2007.
On the other hand, Bulgaria, Slovakia, Ireland and Hungary show an exceptional improvement in agricultural income per worker – in the Irish case, this partly reflects the exceptional increase of 28% in agricultural factor income in 2017 compared to 2016 due to the milk bonanza in that country in that year.
The figures for Indicator B (shown in the right-hand panel) follow a similar pattern but with some important exceptions. Recall that the main difference between the two indicators is that entrepreneurial income is calculated after deduction of payments for salaried labour, interest on loans and rent on land. These expenses tend to be relatively fixed from year to year in individual countries, so entrepreneurial income shows greater variability than does agricultural factor income. Also, the importance of these payments to external factors differs across countries.
Two countries show extreme movements, for different reasons. The Danish figure for Indicator B in 2017 was 14 times greater than in 2010, because of the very high interest share in factor income in Denmark. The Slovakian figure, on the other hand, shows a remarkable deterioration in Indicator B despite its very good performance on indicator A. This is more difficult to explain but the high share of corporate farms in that country with corresponding high outlays on salaried labour suggests not too much reliance should be placed on this figure.
Conclusions
Thus, EU agriculture continues to be distinguished by great heterogeneity in income developments in different Member States. In turn, differences in income developments per worker across Member States are due to a variety of reasons:
• Differences in the rate of growth in agricultural output across Member States;
• Differences in the composition of output given that output prices for different commodities change at different rates:
• Differences in the composition of inputs given that input prices for different inputs change at different rates:
• Differences in the shares of intermediate inputs in the gross value of agricultural output, given that the prices of intermediate inputs change at a different rate to the price index of agricultural outputs;
• Differences in rates of labour productivity growth, reflecting both differences in the rate of labour outflow from agriculture as well as differences in the rates of productivity growth (which will reflect differences in the growth rate of intermediate inputs).
• In the case of entrepreneurial income, differences in the weight of payments to external factors in gross agricultural output as well as differences in price changes for external factors across countries.
For these reasons, income developments will always be heterogeneous across Member States, and this should be remembered when agricultural income trends in the EU are under discussion.
This post was written by Alan Matthews
Photo credit: English summer by Tony Armstrong via Flickr, Creative Commons licence
