In thinking about the prospects for a future CAP reform, one of the relevant factors is the political economy of member states’ negotiating positions, which in turn is heavily influenced by their net position as a contributor to or a beneficiary from CAP expenditure. Countries are more likely to defend a high level of CAP expenditure if they are likely to benefit from it. The net transfers arising from the CAP budget are thus an important predictor of a country’s stance on CAP reform.
These net transfer positions are not routinely published, although DG Budget provides the raw data in its annual calculation of the ‘operating budgetary balances’ of member states. A member state’s operating budgetary balance is the difference between allocated operating expenditure (excluding administration) and its ‘national contribution’ to the EU budget.
A member state’s ‘national contribution’ represents its contribution to the EU budget’s ‘own resources’ apart from the traditional own resources of customs duties and sugar levies. In other words, it covers its value added tax (VAT) and gross national income (GNI) contributions adjusted for rebates.
Because the traditional own resources are considered to arise directly from the application of common policies, they are not considered as ‘national contributions’ but as pure EU revenue (to be totally precise, an adjusted national contribution is used in the calculation to take account of the omission of administrative expenditure, see this description on the DG Budget website for a fuller explanation).
DG Budget helpfully makes the information behind the calculation of member states’ operating budgetary balances available in a comprehensive spreadsheet covering the years 2000-2014, and this information can be used to calculate net transfers arising from the CAP. For this purpose, CAP expenditure is assumed to consist of the directly allocated expenditures in the two CAP funds, the EAGF and the EAFRD. In 2014, for example, 97% of expenditure under these two funds could be directly allocated. Other expenditure items in the annual agricultural budget (Title 05) such as pre-accession assistance or food research under Horizon 2020 are not covered by these funds.
Each member state’s contribution to CAP expenditure is assumed to be equal to the share of its national contribution in total national contributions. If we are talking about a change in the CAP budget which would require an increase/decrease in the overall EU budget, then it would be more appropriate to take each country’s share of the total GNI own resource, as this is the marginal resource which is called upon when the overall amount of the EU budget is changed. However, if we are talking about the CAP budget being switched to some other priority within the EU budget, then the average calculation adopted here is the correct one. In any case, the distribution of the VAT own resource across member states is now very similar to the distribution of the GNI own resource.
Redistribution through the CAP
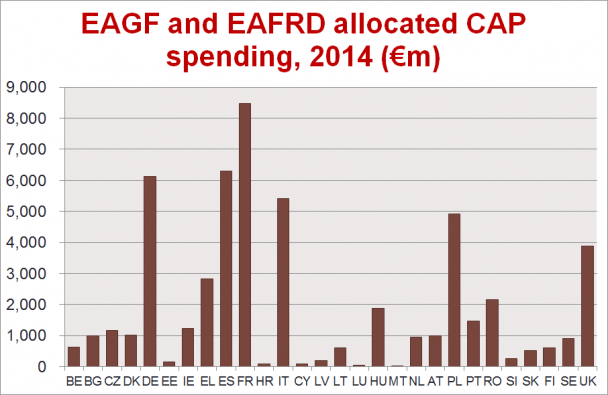
First, we examine the pattern of CAP expenditure by member state. France tops the league of beneficiaries in 2014, with CAP inflows of €8.5 billion, closely followed by Spain, Germany and Italy. Poland and the UK are next in line. A lot of member states receive quite small sums in absolute terms, less than €1 billion.

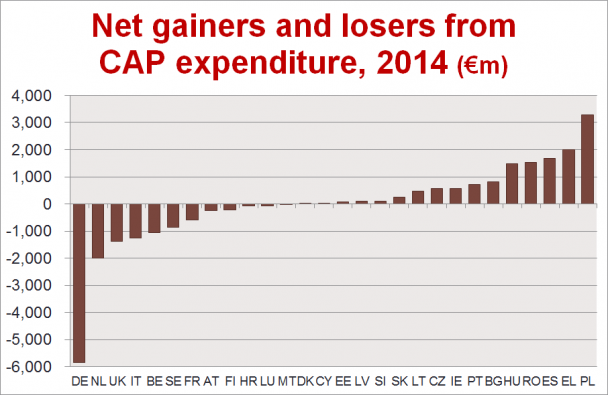
Next, we examine the pattern of net transfers arising from the 2014 budget, defined as CAP inflows less each member state’s contribution to the CAP budget. Although the total allocated CAP budget was €54 billion in 2014, much of each member state’s contribution to the CAP returns to it as CAP expenditure, so the total amount redistributed or reallocated between member states in 2014 was €13.6 billion. Although 12 member states were net contributors in 2014, 43% of the net contribution was paid by Germany alone, with smaller amounts paid by the Netherlands, the UK and Italy. Indeed, even France was a net contributor to the CAP in 2014, despite being the single largest beneficiary. So was the EU’s newest member, Croatia, although this may have been due to slow disbursement of committed rural development funds.
On the other side of the graph, we see the net beneficiaries. This group is dominated by Poland, following by Greece and Spain, and then Romania, Hungary and Bulgaria.

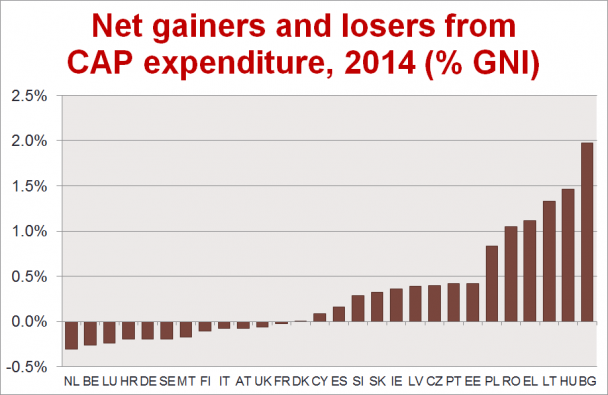
Larger countries will tend to figure more prominently among either the net payers or net beneficiaries simply because of their size. It is therefore interesting to repeat the previous figure by relating the net transfers to the size of each country’s GNI.
Relative to their size, it turns out that it is the three Benelux countries which make the largest net contributions to the CAP budget of between 0.25% and 0.3% of GNI, with Croatia, Germany, Sweden and Malta all contributing 0.2% of their GNI.
On the other side of the chart, the big winners are all countries to the east of Europe. Countries with net transfers greater than 1% of their GNI include Romania (1.05%), Greece (1.12%), Latvia (1.33%), Hungary (1.46%) and Bulgaria (1.97%).

It is interesting to ask how these shares have changed over time. We choose to make the comparison with 2008 which was the year in which the CAP Health Check was agreed. In those earlier years, CAP payments to the new member states were only being phased in, so we would expect their net gains from the CAP to be somewhat smaller. Also, 2014 was the first year in which the new external convergence formula under the CAP 2013 reform was in place, which also began to shift resources to the new member states. Rankings on the contribution side will be influenced by relative growth rates.
As expected, although the total allocated CAP budget in 2008 was almost the same in nominal terms as in 2014 (€51.3 billion compared to €54.0 billion), the total amount redistributed between member states as a result of the CAP was much smaller (€9.3 billion compared to €13.6 billion) (note Croatia is not included in the 2008 figures). Thus, the percentage losses (relative to GNI) of the Benelux countries and other net contributors were slightly smaller than in 2014. Germany, for example, redistributed 0.14% of its GNI through the CAP in 2008: this share was 0.20% in 2014.
In terms of beneficiaries, no beneficiary in 2008 received more than 1% of its GNI through net CAP transfers. Greece came closest, at 0.96% of its GNI, followed by Bulgaria (0.77%) and Ireland (0.57%).

Conclusions
Thus, we see that net transfers through the CAP have increased in recent years as CAP payments have been phased in in the new member states. As a result, the net transfers from the net contributing member states have slightly increased relative to their GNI while some net beneficiaries in 2008 (notably France, Austria and Denmark) have become net contributors (France and Austria) or moved to balance (Denmark) in 2014. This process will continue, albeit slowly, over the remaining years of the current Multi-annual Financial Framework as the process of external convergence continues.
The question posed is whether these changes are large enough to result in any changes in these countries’ negotiating positions on the CAP. Attention is often focused on Germany because of the large size of its net contribution in absolute terms, but as a percentage of its GNI Germany’s net contribution to the CAP budget is not an outlier. Perhaps the more interesting country is France. In crude terms, the common financing of the CAP was originally put in place to ensure a net transfer to France as a quid pro quo for opening its market to German industrial products. Now that France has become a net contributor to the CAP, will it continue to defend the policy so strongly in the future?
This post was written by Alan Matthews.
Photo credit: The European Union


Indeed, it is interesting how does the perception of the Eastern part of EU differ from the real picture (net gainers and loosers). First, it is common to think that CAP is adjusted to old member states’ needs and “modern” directions (environmental, rural development measures ect.), that farmers there benefit much more from CAP then in new member states.
Could you comment why is that the case: how come mostly more developed countries are net loosers (is it simply because their share of agriculture in GNI is much smaller then in less developed member states?
And what happened with France? How come it became net looser?
@Ornella
I apologise that I missed your comment when you made it so I am only now responding. You make two good points. I think that the reason farmers in the new member states may believe that they lose out relative to farmers in the old member states probably has to do with the (on average) lower levels of CAP Pillar 1 payments per hectare and as well (what you point to) the sense that some of the priorities of the CAP, such as better environmental management, may seem to have a greater relevance in the ‘old’ EU. The fact that, at the country level, the new member states turn out to benefit more strongly from net CAP transfers is because of their overall larger agricultural sectors (as you recognise) – it is not because the older member states make a larger proportionate contribution to the EU budget as the gross revenue contribution as a percentage of each country’s GNI is very similar.
Part of the explanation why France has become a small net contributor is because of enlargement. Because the new member states are net gainers from the CAP, the additional cost of the transfers they receive reduces the net gains of the previous net beneficiaries, and in the case of France contributes to reversing the sign.