

It is not possible to be definitive about the market and trade effects of the next CAP reform, for two reasons. One is that the Commission’s legislative proposal published in June 2018 is just that, a proposal, that may well be altered, even quite radically, before the new CAP regulations are agreed. The other is that, under the Commission’s proposal, Member States are given significantly more flexibility than they have at present to craft their own agricultural policy interventions in the context of their CAP Strategic Plans. Until these Plans are approved, it is not possible to predict, inter alia, the level of environmental and climate ambition that EU farmers will be asked to meet after 2020, the extent of targeting and redistribution of Pillar 1 direct payments, or the use that will be made of coupled payments.
Nonetheless, some guidance on the likely scale and direction of the market and trade effects is available from the Impact Assessment (IA) that accompanied the Commission’s legislative proposals. The IA examined the potential impact of different choices that Member States might make by simulating the outcomes of a range of scenario options both using statistical models and, to cover issues that were not sufficiently captured in the models, a Multi-criteria Analysis which also made use of expert opinion.
Impact Assessment scenarios
Three options with sub-options (five options in all) were explored in detail in addition to a baseline scenario. A fifth option had been identified in the Inception Impact Assessment, the ‘No-CAP’ option in which all CAP instruments are eliminated (which would have been Option 2 in the list of scenarios below) but was not pursued in the IA on the advice of the Regulatory Scrutiny Board as not being relevant nor in line with the Treaty objectives. However, results from this option were assessed in parallel work undertaken by the Joint Research Council in its simulation modelling of alternative CAP futures called SCENAR 2030.
In the Impact Assessment, the same CAP budget was assumed in each of the five scenarios; this was set at 8.9% below the current budget to reflect the impact of Brexit on the CAP budget. It was assumed that expenditure for market intervention and stabilisation will be held constant, so this budget assumption translated into a 10% reduction in Pillar 1 direct payments. The post-Brexit baseline was based on this budget reduction but assumed a continuation of the CAP 2013 into the future. The distribution of this budget between Member States was held unchanged from the current programming period and thus takes account of revealed Member State preferences regarding transfers between the Pillars.
The purpose of the five options was to explore the impact of different decisions with respect to (a) the level of ambition with respect to environmental and climate objectives and (b) the targeting and redistribution of direct payments. Some options put greater emphasis on environmental objectives than on economic sustainability (with a greater share of the CAP budget devoted to agri-environment-climate schemes and a lower share allocated to direct income support). Some options put greater emphasis on redistribution where direct payments were focused on small and medium size farms to keep jobs in rural areas. Some options take money from basic income support to fund new risk management instruments. These different scenarios were then translated into more detailed schemes and payment levels for modelling purposes.
These dimensions were chosen to reflect the areas where Member States would have greater discretion to decide how to achieve the CAP specific objectives in their CAP Strategic Plans. The new conditionality applied across all five options. The IA underlined that, because of this design, no option was intended as a preferred option and that options were not mutually exclusive.
Each option is made up of many elements, where the weightings given to each element differ across options. It is thus difficult to summarise the differences between options in a simple way. The main differences between options that drive the market and trade results are highlighted here.
Option 1. The post-Brexit baseline. This option assumes the continuation of the CAP2013 reform to 2030 but with an overall reduction of 8.9% in the CAP budget (10% in Pillar 1 direct payments) due to the departure of the United Kingdom from the EU. However, although the impact of Brexit on the EU budget is accounted for in the baseline, its potential impact on markets and trade does not appear to have been taken into account in simulating the various options.
Option 3a. Ambitious environmental focus, limited basic income support. What drives the results in this scenario is that 60% of the direct payment ceiling is allocated to the eco-scheme, 10% to risk management and 5% to assistance to young farmers, leaving just 25% for basic income support. Coupled support is eliminated.
Option 3b. More conservative environmental ambition than Option 3a and more emphasis on redistribution of payments. In this scenario, 30% of direct payments are allocated to the eco-scheme, 5% to risk management, 2% to young farmers, and 12% to coupled support (reflecting the status quo). The remaining 50% of direct payments are used for basic income support, including 15% for the redistributive payment.
Option 4. Balance between environmental and income objectives. Option 4 does not make use of the eco-scheme, so apart from some allocation to risk management (5%) and to coupled support and young farmers (5%), the balance is available for basic income support. However, the basic payment is adjusted according to land type (arable land, permanent grassland, permanent crops) with redistribution to permanent grassland at the expense of permanent crops. Coupled support is limited to extensive livestock production. Within this option, two sub-options are modelled.
Option 4a. Strong income support with high environmental ambition. In addition to the general characteristics just described, this option aims to achieve equally ambitious environmental outcomes as Option 3a, but to do this through mandatory measures by implementing higher requirements exceeding basic conditionality.
Option 4b. Strong income support with limited environmental ambition. This option has no requirements beyond basic conditionality.
Option 5. Strong focus on small farms and the environment. This option shifts the focus to small and medium size farmers to keep jobs in rural areas. The basic income support payment is modulated by size and a low maximum payment per farm is introduced through capping. Coupled support and young farmers account for 15% of direct payment envelopes. In addition, Member States are obliged to allocate 30% of pillar I payments to provide top-ups for four schemes that would be voluntary for farmers, organic farming, permanent grassland, Areas with Natural Constraints (ANC) and linear landscape elements. This ring-fencing obligation would further encourage climate action and sustainable management of natural resources.
It is not possible to rank these options a priori in terms of market and trade effects because of the many differences between them, e.g. an option with high environmental ambition (which will lead to stronger market and trade effects) may also include coupled payments (which will mitigate these effects). On a priori grounds, we might expect the largest impacts in Option 3a where basic income support is cut back the most and coupled support is eliminated, and more limited effects in Option 4b which has a strong focus on income support and limited environmental ambition. However, empirical modelling is required to assess these market and trade impacts in detail.
Baseline scenario
The baseline option assumed the continuation of the 2013 CAP reform and a market environment to 2030 as described in the 2017 EU agricultural markets outlook. Since the negotiations on the UK’s exit from the EU are ongoing, the projections are made on basis of a European Union of 28 Member States, i.e. including the UK, for the full duration of the outlook period. In the baseline, production is assumed to increase by 2% per annum in nominal terms (thus almost stagnating in real terms and with risks of output variability).
Actual and projected changes in self-sufficiency rates to 2030 by product, which also takes into account changes in consumption within the EU, are shown in Table 1. Changes in self-sufficiency are equivalent to changes in the EU’s net trade position. Figures are only available for selected commodities and are not provided for some commodities of potential interest to some trading partners, such as fruits and vegetables, wine and olive oil. The main message from this table is one of stability in the EU’s net trade position to 2030 under the business-as-usual scenario. The main exception is sugar, where the removal of sugar quotas in 2015 has allowed production to expand and turned the EU into a net sugar exporter. There is also an expectation that maize self-sufficiency will increase, but that self-sufficiency in rice will drop somewhat. But, overall, no major changes in the EU’s net trade position are expected over the coming decade in the absence of further reforms.

Impact assessment of the modelled options
In assessing the possible impacts of the Commission’s proposal on markets and trade, the following insights from the scenario modelling in the IA are relevant, even though none of the options simulated correspond exactly to that proposal.
• In all scenarios, farm income is reduced compared to the baseline pre-Brexit due to the cut in the CAP budget. Farm income declines even further (by up to 10%) even relative to the baseline post-Brexit in those scenarios where environmental objectives are given priority relative to the basic income support payment.
• Because producers of different enterprises differ in their dependence on direct payments, the differences between options in the relative budget share allocated to basic income support has strong sectoral impacts. Lowering the share of direct payments allocated to basic income support has a strong effect on cattle, crop, sheep and olive producers because direct payments represent a large share of their income. In addition, cattle and sheep sectors, where significant coupled support is currently granted, are more affected when coupled support is removed.
• The extended requirements considered under the new conditionality (e.g. obligation to dedicate more land to non-productive elements, land re-allocation to fulfil crop rotation and cover crop costs) lead to a significant decline in cereal area in favour of set aside and fallow land, and thus to a decline in market revenue of arable crop producers as well as to a deterioration of the EU trade balance.
• Redistribution of support to smaller farms would lead to a strong reduction in support for very large farms, an increase in payments for more intensive farms (smaller on average, selecting products with higher returns) and would result in a decline in support to most extensive farms. The IA points out this last outcome could be mitigated by providing coupled support to extensive livestock systems and top-ups to permanent grassland.
• The redistribution of support to smaller farms also has sectoral effects because different sized farms specialise in different production systems. Redistribution leads to higher income drops for larger farms (mostly cereal producers and extensive livestock farms), while olive growers benefit from this redistribution.
• Higher requirements to increase environmental performance have a bigger impact on crop producers; for example, a three-year rotation affects particularly sugar beet and potato producers. However, a redistribution of support to permanent grassland (for environmental reasons) would benefit extensive systems.
Land use changes. There could be significant changes in land use due to changes in support and environmental requirements (Table 2). Option 1 reflects solely the Brexit impact in cutting direct payments by 10%. It appears that this budget cut alone has no significant change on land use (apart from a surprising minor increase in the area under cereals). However, the CAPRI model on which these results are based also accounts for land abandonment (not shown in the table). The model calculates that it would no longer be profitable to farm around 300,000 ha or 0.2% of the EU’s utilised agricultural area (UAA) if direct payments were reduced. One would expect most of this to come from the permanent grassland category. For this reason it is surprising that the model results shown in Table 2 show no change in the area under permanent grassland under Option 1. However, in any case land use changes due to a cut in direct payments alone are estimated to be very small.
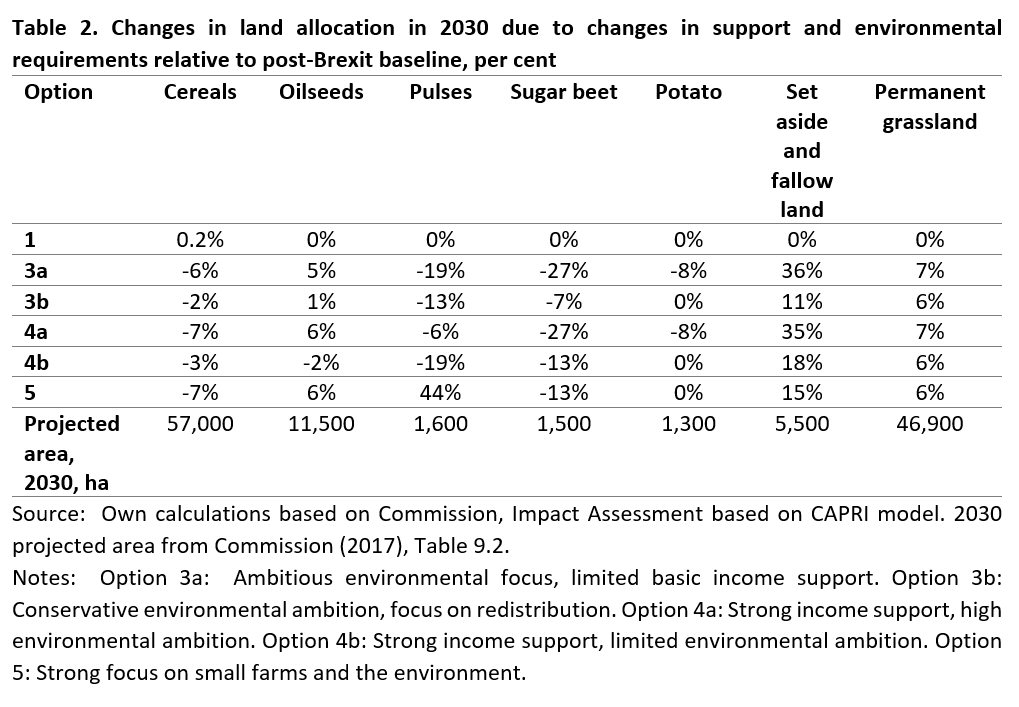
Much bigger land use changes are foreseen when possible reform options related to environmental ambition and coupling are considered in the other scenarios. The overall tendency is for a swing from arable crops to permanent grassland, and an increase in set aside and fallow land, in all options. The latter increase reflects the higher requirements associated with conditionality (the mandatory requirements farmers should observe to be eligible for direct payments). In addition, all options result in a further small reduction in utilised agricultural area (UAA) of up to 0.3% in Option 4a.
Some of the percentage changes in the area allocated to individual crops are quite high, although these should be interpreted in the context of the shares of the total UAA allocated to these crops (e.g. the relatively low share in the case of pulses (protein crops)). The increase in the area under oilseeds derives mainly from the three-year crop rotation obligation, while the declines in the area under pulses (protein crops) derives from the removal of coupled support as well as the fact that nitrogen-fixing crops are no longer eligible to fulfil conditionality requirements nor for the ecological focus area requirements set by Member States with high environmental ambition. The large increase in the area under pulses in Option 5 is due to the top-up payment of €80/ha paid for these crops in this option. The results for sugar beet are not explicitly explained in the IA but likely reflect the removal of coupled support for this crop in almost all options.
Farm income effects. As previously noted, farm income falls in all options due to the budget cut and greater environmental requirements. The figure below shows two panels. The left-hand panel shows the farm income impact of the 10% cut in direct payments due to Brexit. The differences between enterprises reflect the variation in the dependence on direct payments in the income from each enterprise. The right-hand panel shows the further change in farm income relative to the post-Brexit baseline. With just a few exceptions, farm incomes are projected to fall further in all options for all enterprises. This reflects both higher environmental requirements in some options, the removal of coupled support in other options, as well as the redistribution of support (because of the disproportionate impact on income from some enterprises which are particularly specialised on larger farms).

As a generalisation, incomes on livestock farms (sheep, cattle, milk, pigs and poultry) are less affected in the various options that income on crop farms (cereals, oilseeds, sugar beet and olives). The negative income impacts for pig and poultry producers derive mainly from the changes in support and practices on arable land, as most production takes place on farms greater than 10 ha. For milk producers, while the drop in income compared to Option 1 in any of the other options is relatively limited, the IA points out that this average hides significant differences between production systems depending on the balance between support for extensive production and the redistribution of support away from larger farms. The negative income impact on producers of other field crops is amplified by the crop rotation obligation and by the removal of coupled support to sugar beet in almost all options.
However, there can also be large differences in the impact on the income of specific producers depending on the option chosen. As an example, the income of cattle (and sheep) farms is hardest hit in Option 3a both because this option has the smallest share of the direct payments budget allocated to basic income support and because of the removal of coupled support. However, there is no additional reduction in cattle farm incomes apart from that due to the Brexit budget cut in Option 4b because of the higher basic income support directed at permanent grassland and the payment of coupled support for extensive livestock production.
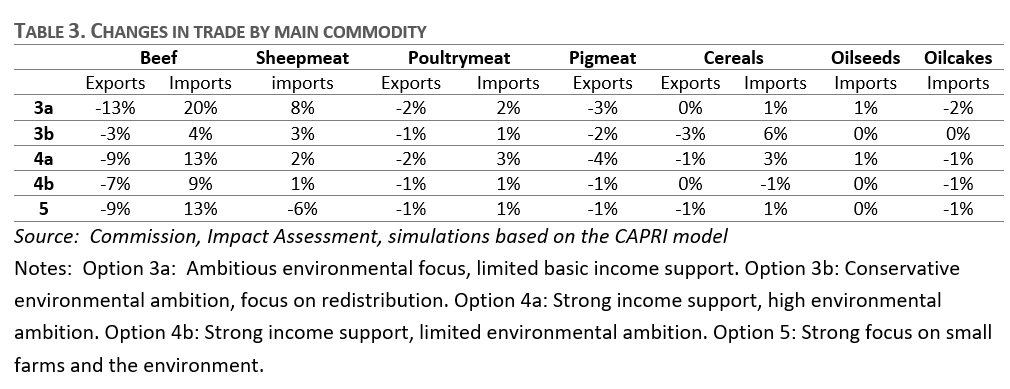
Market and trade impacts. Given these income effects, farmers react by reducing production in view of lower expected returns. The IA does not give directly the production effects but presents the impacts on net trade (Table 3). For all commodities except for oilcakes there is a deterioration in the EU trade balance. There are increased imports of beef, sheep and poultry meat as well as maize in almost all options and reduced exports of mainly beef and wheat. As for the land use change changes shown in Table 2, the percentage changes need to be interpreted in the context of the initial levels of net trade. While the percentage changes are larger for beef, the overall EU beef market is very close to self-sufficiency and initial levels of both imports and exports are very small. Trade in dairy products is not affected. The EU trade balance reduces most in Options 4a and 3a, and then 3b and the lowest decline is simulated in Options 4b and 5. Overall, however, the changes are small in magnitude in most options, and no radical changes in trade flows are projected for the range of scenarios considered.
Implications
The options reviewed in the IA cover a wide range of different elements. None of them match precisely the Commission’s MFF proposal in May 2018 and legislative proposal in June 2018. For example, the MFF proposal is for a smaller cut in the CAP budget than assumed in the IA. Instead of an overall cut of 8.9% and a cut in Pillar 1 direct payments of 10%, the MFF proposal is for a cut of 5% in nominal terms in the total CAP budget and a cut in Pillar 1 direct payments of around 2%.
As noted at the outset, two other reasons why the precise impacts of the CAP after 2020 cannot be predicted at this stage are that both the Commission’s MFF and CAP proposals may be modified, even quite radically, before they are approved; and that the proposal leaves a great deal of flexibility to Member States with respect to the choice of instruments they include in their Strategic Plans. Until these Plans are approved, it is not possible to predict the level of environmental and climate ambition that EU farmers will be asked to meet after 2020, the extent of targeting and redistribution of Pillar 1 direct payments, or the use that will be made of coupled payments. Therefore the market and trade impacts will remain uncertain.
One message that emerges is that there is a trade-off, at least in the short run, between farm income levels and environmental ambition. This trade-off is most apparent for arable producers, particularly in the case of higher conditionality requirements. This trade-off is central to the debate on the CAP post 2020. The farm unions argue that farmers cannot be asked to meet higher environmental and climate requirements at the same time as less money is available for the CAP budget. Environmentalists argue that these higher requirements are only internalising some of the external costs of agricultural practices, and that the existing budget can only be justified to the extent that it supports farmers in the transition to a more sustainable agriculture.
The reliance of EU farm income on direct payments is often used by the EU’s trading partners as evidence that these payments must have production and trade-distorting effects. The results in the IA model simulations suggest that there are larger production and trade effects from changes in mandatory environmental standards than from changes in direct payments. This conclusion is more implicit than explicit in the simulation results, because the various options assume different combinations of environmental ambition and income support. It is based partly on the very limited changes in land use observed in the model results when the post-Brexit budget cut is imposed.
This conclusion cannot be used to prove that direct payments have only limited production and trade effects, as this result is derived from assumptions made when running the model. In the CAPRI model used for these results, decoupled payments are implemented as a direct payment linked to land, where the amount paid is the same regardless of how the land is used, if it is not completely abandoned. Thus, the payment has the effect of increasing land rents (compared to no policy), increasing agricultural income and preventing land abandonment, but has no effect on the choice between eligible crops. This approach assumes that decoupled payments are highly decoupled from production in practice. Other assumptions are also possible (there is a good discussion of the production effects of decoupled payments in the JRC SCENAR 2030 study on p. 45) and would give rise to different results. However, the IA results suggest that the real trade-distorting subsidy to EU agriculture is the failure to internalise the full costs of the damage to the environment due to unsustainable agricultural practices. It would be helpful to try to provide more empirical support for this proposition.
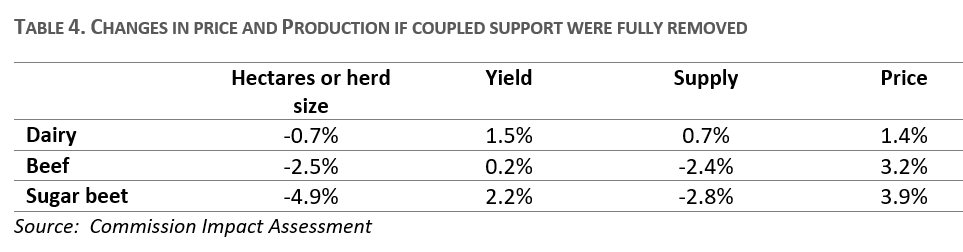
As a final observation, the IA leaves some ambiguity about the trade-distorting effects of coupled payments (Table 4). While removing coupled support for beef and sugar beet would reduce supply, the CAPRI model results suggest that it would lead to an increase in milk supply. That coupled payments apparently reduce the supply of milk is certainly not the intention of the many Member States that use this instrument. This counter-intuitive result arises because a reduction in the dairy herd due to the elimination of coupled support leads to an increase in dairy cow productivity that more than offsets the smaller herd size. The IA cites the finding in the World Bank study Thinking CAP: Supporting Agricultural Incomes and Jobs in the EU that coupled supports prevent productivity increases contrary to decoupled and Pillar 2 payments, but still this counter-intuitive result is surprising.
The Commission proposals, by removing any quantitative limits on this support, albeit while maintaining a financial ceiling, will likely exacerbate these trade-distorting effects in future. As these are payments by Member States to their own farmers, it is not only farmers in third countries but also farmers in other Member States who are adversely affected by these supports.
This post was written by Alan Matthews.
Photo credit: Courtesy of Davy Landman_via_flickr_cc_by-sa_2.0
