
A particular type of farm structure is not an explicit policy objective of the EU’s Common Agricultural Policy (CAP). However, facilitating structural change is an objective of the CAP, set out in Article 39 of the Treaty on the Functioning of the European Union, as a way of ensuring a fair standard of living for the agricultural community and increasing the individual earnings of persons engaged in agriculture (the Treaty language speaks of “ensuring the rational development of agricultural production and the optimum utilisation of the factors of production, in particular labour”).
However, there is a widely-shared view that it is desirable to maintain the family farm model of European agriculture. There also seems to be broad political support for the view that assistance should be targeted on smaller family farms. There is keen interest in the evolution of agricultural structures, with many regretting the decline in the number of smaller farms and criticising the emergence of larger, ‘industrial’ holdings.
One way to track changes in farm structure is to examine trends in the average size of holding, or average herd size in the case of livestock farms. However, this measure can seriously underestimate the pace of change where much of the growth (in area farmed, or in livestock numbers) takes place on the larger holdings. The persistence of many small holdings, even though the share of the land or livestock that they control is small and may be falling, tends to mask the extent of structural change as measured by averages.
The midpoint size
An alternative farm structure metric that can be used to track changes in farm structure which takes account of this phenomenon is the midpoint farm size or herd size. The midpoint size (sometimes called the hectare-weighted median when discussing farm size) is defined as the size that marks the middle of the distribution of the variable of interest, whether farm area or livestock. Taking farm area as an example, the midpoint size divides the distribution into two parts; 50% of the total agricultural area is operated by farms of a larger size and the other 50% by farms of a smaller size than the midpoint size.
This measure better captures the extent of farmland or livestock concentration than average (mean) size. Another advantage is that it facilitates a more accurate comparison of farm structure across countries. Countries often differ in the minimum size threshold they use to define the farm population (some countries might use a minimum threshold of 1 ha, others 5 ha, and yet others a threshold based on the value of sales). These different thresholds can mean big differences in the number of very small farms included in the farm population, which can greatly affect the calculated average farm size, but has a much smaller impact on the midpoint farm size.
A 2016 OECD paper by Bokusheva and Kimura examines cross-county differences in farm size distributions and explains the strengths and weaknesses of this and other farm structure statistics. That paper also presents results using various metrics for selected farm enterprises for some EU and non-EU countries based on the work of the OECD Network for Farm-Level Analysis. The results, which include changes in midpoint sizes, are presented for five-yearly intervals from 1995 to 2010 though the 1995 data are often missing for the included EU countries.
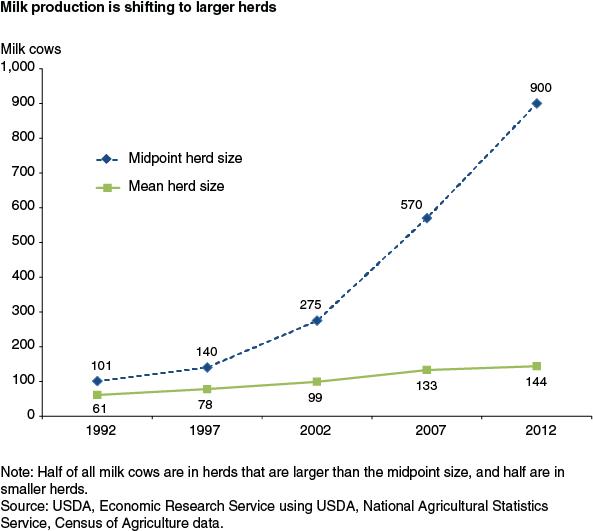
The following two graphs (click on all graphs to enlarge) show a comparison of changes in the mean and midpoint size for cropland area and dairy herds in the US (the cropland chart is taken from this USDA report while the dairy herd chart comes from this USDA publication). The cropland chart is interesting because it shows almost no change in the average size of arable area on farms (because the largest and smallest crop farms grew in number while farms in the middle declined). At the same time, the midpoint size doubled, from around 600 acres to 1,200 acres over the same period.

The disparity in the trends is even more marked in the case of dairy herd size. While the size of the average dairy herd has more than doubled over a 20-year period, the midpoint size has increased nine times. Half of all US milk production is now coming from herds with more than 900 cows, assuming similar yields in herds of different sizes.
European comparisons for dairy herds
I thought it would be interesting to derive a similar chart for EU dairy herd size. Average herd size is easily available, but the midpoint size is not. I do not have access to the raw survey data which would be necessary to derive the midpoint size, but one can make a reasonable guess using the published herd structure data by size class. Invariably, the midpoint size falls within a herd size class (say, for example, 20-29 cows).
To derive an estimate of the midpoint size, we assume that dairy herds are evenly distributed within a size class, i.e. there are the same number of total cows in herds of size 20, 21, 22, etc. With this assumption, it is possible to calculate the herd size which precisely divides the number of cows into two equal halves. The assumption is likely to give a slight upward bias to my midpoint size estimates, as for the relevant size classes it is probable that cows are bunched in the smaller herd sizes within a class.
In the EU, farm structure statistics are published by Eurostat as part of the regular Farm Structures Survey (FSS). This is a sample survey undertaken by Member States every two or three years which is currently mandated by Regulation (EC) No 1166/2008. In addition, a full agricultural census is conducted every ten years in order to provide a register of farm holdings and the other information required for the stratification of the sample surveys. For the EU15 with the exception of Germany (so EU14), the FSS data go back to 1990. For the EU12 (excluding Croatia), the data begin in 2003. The 2008 Regulation specified that surveys would be carried out in 2010, 2013 and 2016. As the data from the 2016 FSS will not become available until later this year (Eurostat promises an update of its farm structures page in September), the latest data on farm structure trends relates to the year 2013.
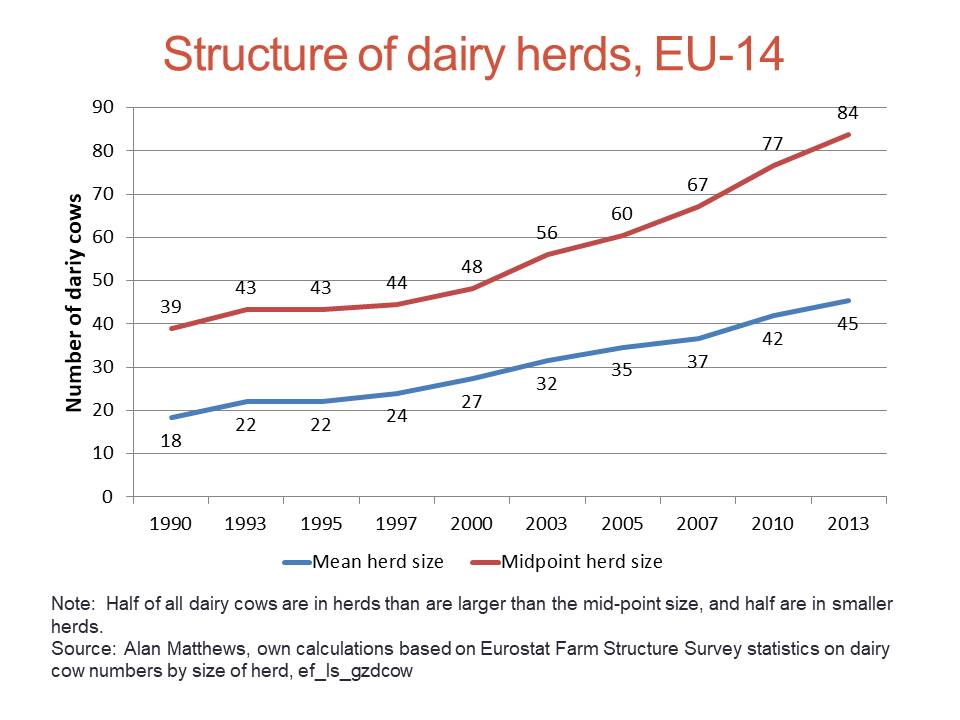
The EU14 chart is shown below. It is striking in various ways. Average herd sizes are smaller in the EU than in the US. In 1992 (1990 in the EU), the US average herd size was 61 and the EU average herd size was 16. By 2012 (2013 in the EU), these averages had increased to 144 in the US and 45 in the EU. If anything, average herd sizes increased at a faster rate in the EU than in the US in these two decades (though note that the EU time period is slightly longer by three years). A reasonable conclusion to draw would be that structural change was proceeding at roughly the same rate in the two regions.
However, the midpoint sizes tell a very different story. More and more milk production in the US is coming from the relatively larger herds. As noted, the midpoint size increased from 101 to 900. This is not the case in the EU. While the average herd size more than doubled (from 18 to 45 cows between 1990 and 2013), the midpoint size increased at a slower rate (from 39 to 84 cows). In the EU, growth in cow numbers was slightly faster in the smaller herd sizes, at least in the older Member States.
An obvious question is to ask is why do we observe this difference with the US? The quota regime in the EU likely slowed down the rate of structural change as in many countries quota transfers were regulated and smaller herds were given priority. Other factors, such as the higher cost of land in the EU, planning regulations for larger dairies, and difficulty in accessing labour, may also be part of the explanation. To the extent that the quota regime played a role, with the abolition of quotas there may be a greater tendency to shift to a ‘US’ model of structural change in the future.
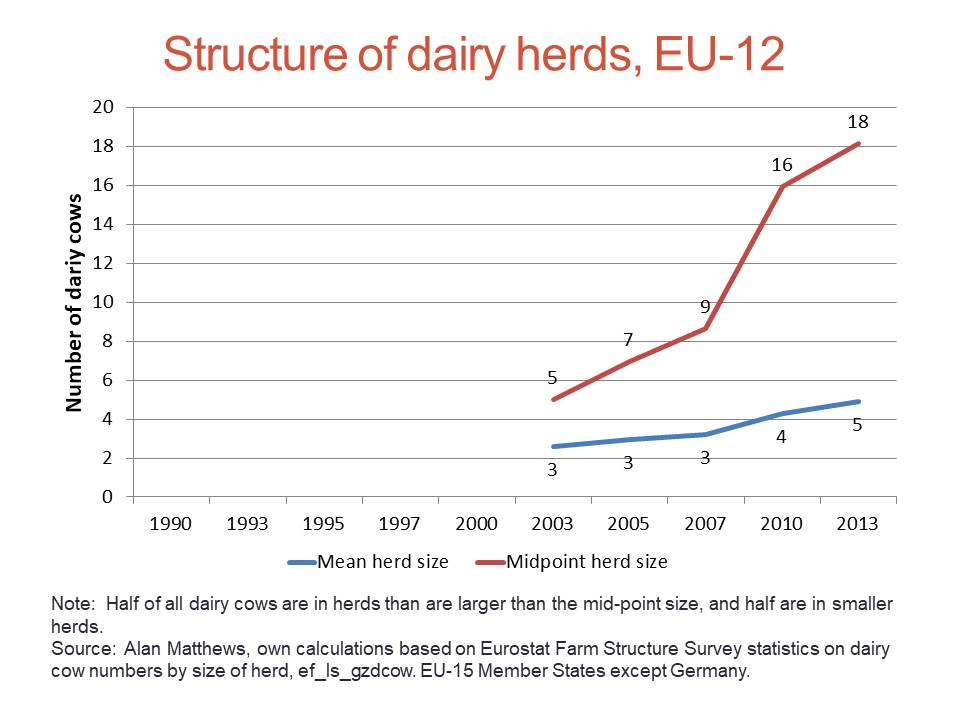
The pattern of change in the EU12 is shown in the next chart. The time period is much shorter and, perhaps not surprisingly given the very small average size of herds, growth in production is growing faster in the larger herds. The fact that 50% of milk production still comes from herds of less than 18 cows highlights the very different production structures in the new Member States.
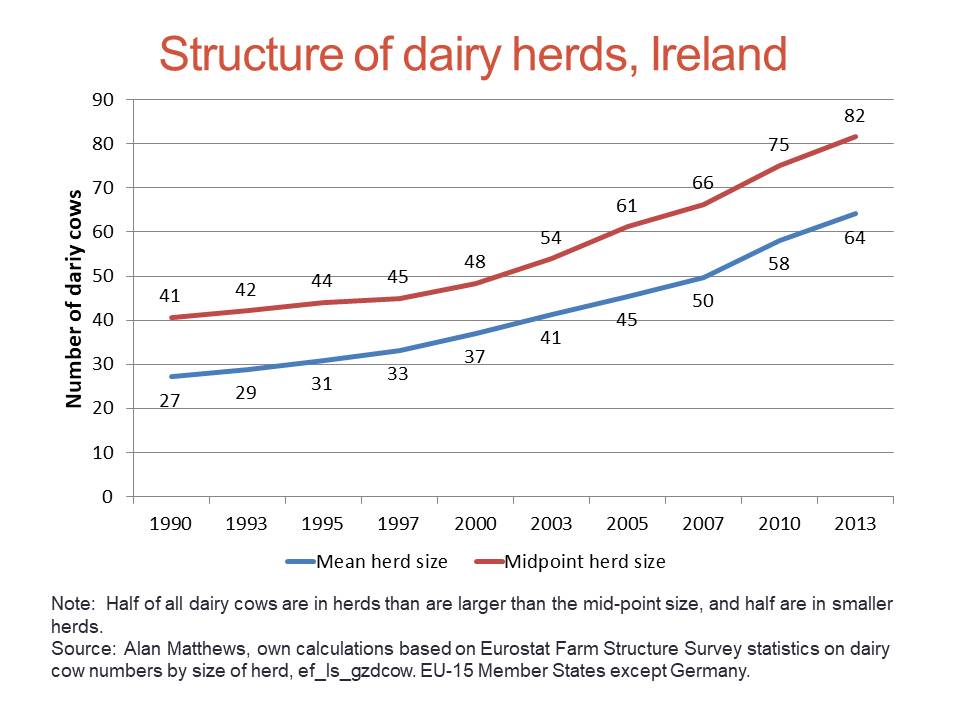
The final chart shows structural change in a single Member State, where I have chosen Ireland. The pattern of structural change in Ireland mirrors that for the older Member States as a whole, where growth of production has been faster on the smaller farms.
Conclusions
The contrast between the patterns of structural change in the US and EU dairy herd structure is striking. I tentatively suggest that the existence of the quota regime during the observation period in the EU is the main explanation. With the elimination of dairy quotas, one would expect future structural changes in EU dairy farms to follow more closely the ‘US’ model. It will be important to be able to monitor whether this is the case or not.
Where inequality in farm size distributions is increasing, data on the increase in average farm or herd sizes will underestimate the extent of structural change in agriculture. For this reason, the midpoint size is a more meaningful measure of structural change. The EU statistical authorities (Eurostat and DG AGRI) do not currently make use of this measure in presenting farm structures data. I would recommend that this should become routine. In particular, when presenting the results of the 2016 FFS later this year, Eurostat should be encouraged to present the midpoint sizes for various distributions and how these have changed over time.
A related observation is that the size class data used for the public presentation of FSS results should be updated to take account of the growing concentration of production assets on larger holdings. For example, the upper class size for dairy herds is 100 cows and above, but in 2013 50% of all dairy cows in the Netherlands were in this size class, and 50% in the other six size classes. By 2016 well over half of all cows could be in this single size class. Subject to confidentiality requirements, it would be desirable to provide a further breakdown of farm and herd sizes in the very largest size groups.
This post was written by Alan Matthews
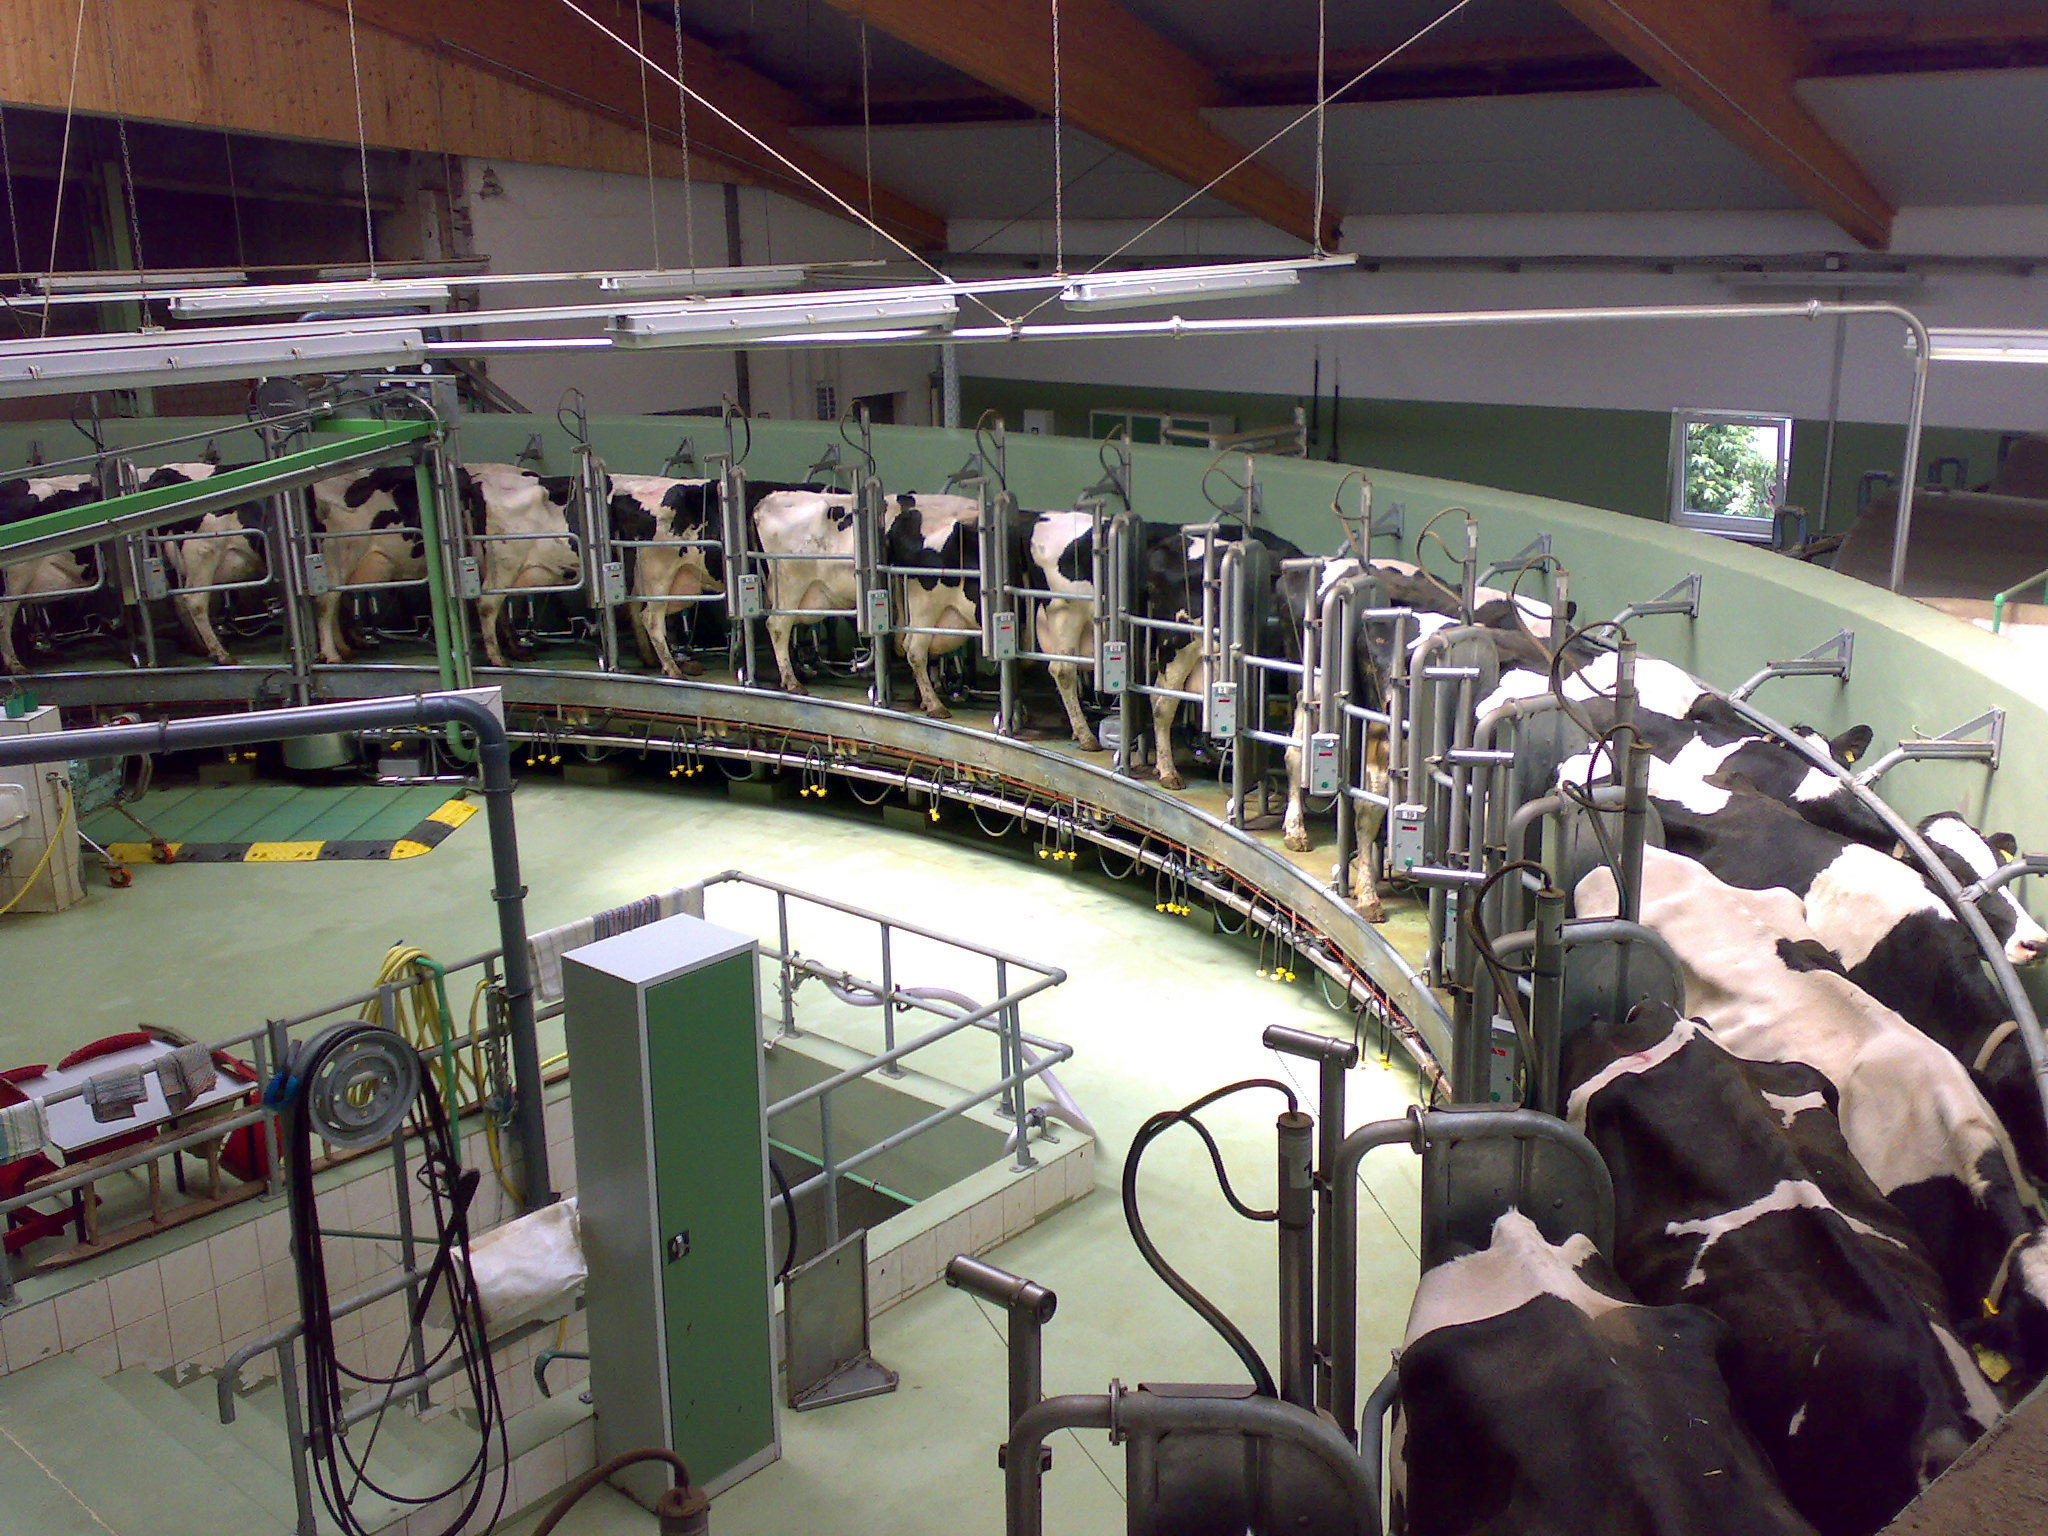
Photo credit: Wikipedia, under a Creative Commons licence
