
There is considerable interest in the amount of support that farmers in the EU receive through public payments. The Commission in its MFF proposal in May 2018 proposed a reduction in the CAP budget (partially offset by increased co-financing contributions from Member States). Member States in the AGRIFISH Council and farm unions as well as the European Parliament have pushed back against this reduction.
A French Memorandum presented to the June 2018 meeting of the AGRIFISH Council asserts that “this decrease on both pillars would undoubtedly threaten the viability of European farms, the income of farmers and their ability to meet the citizen requirements for a healthy, sustainable, affordable and quality food as well as protection of environment and adaptation to climate change”.
To assess whether this is likely to be the case or not, we need factual information on the current importance of CAP payments in farm incomes. Three sources of statistical information and indicators are available: (i) the DG AGRI indicator which shows the ratio of direct payments and total subsidies to farm income: (ii) the FADN indicator which shows the ratio of farm payments received to farm income; (iii) the OECD Producer Support Estimate, which can also be used to derive the ratio of farm support to farm income. Each of these measures has their own strengths and weaknesses. I have explored the FADN indicator in some depth in this blog post.
In this post, I suggest making greater use of a fourth measure; (iv) a derived EUROSTAT indicator showing the ratio of farm payments to farm income. It is the most up-to date measure and can also be used to make comparisons between Member States. The measure is easily derived from the Eurostat Economic Accounts for Agriculture. Indeed, it is so straightforward it is surprising it is not reported and used more widely, although DG AGRI does seem to use it in constructing its indicator as we explain in the next section.
We first look at each of the existing measures in more detail before presenting the data for the derived Eurostat indicator. Finally, we suggest some ways in which this indicator could be used and improved.
A word on terminology before I begin. What we want to measure with these indicators is direct budget support to individual farmers. The OECD Producer Support Estimate is unique in that it also includes support to the agricultural sector not received by individual farmers (called General Services Support), plus in addition it includes support paid by consumers in the form of higher prices in what it calls Market Price Support. I will use the terms ‘subsidy’ and ‘support’ interchangeably in this post, but when I refer to support I mean budget support directly paid to farmers. In some situations I refer to the narrower concept of ‘operating subsidies’ which excludes support for investment from the total budget support directly paid to farmers.
There are also different ways of expressing farm income. One is to use the concept of factor income (which is made up of net value added from production at basic prices plus other subsidies on production less other taxes on production). This represents the total available to remunerate all fixed factors of production in agriculture (labour, land and capital). Alternatively, we can focus on family farm income (also called entrepreneurial income) which is what is available to remunerate the family-owned factors of production once wages paid to hired labour, rents paid for the leasing of land, and interest charges paid on borrowed capital, are deducted from factor income. Support as a share of family farm income will always be higher than its share of factor income.
The DG AGRI indicator
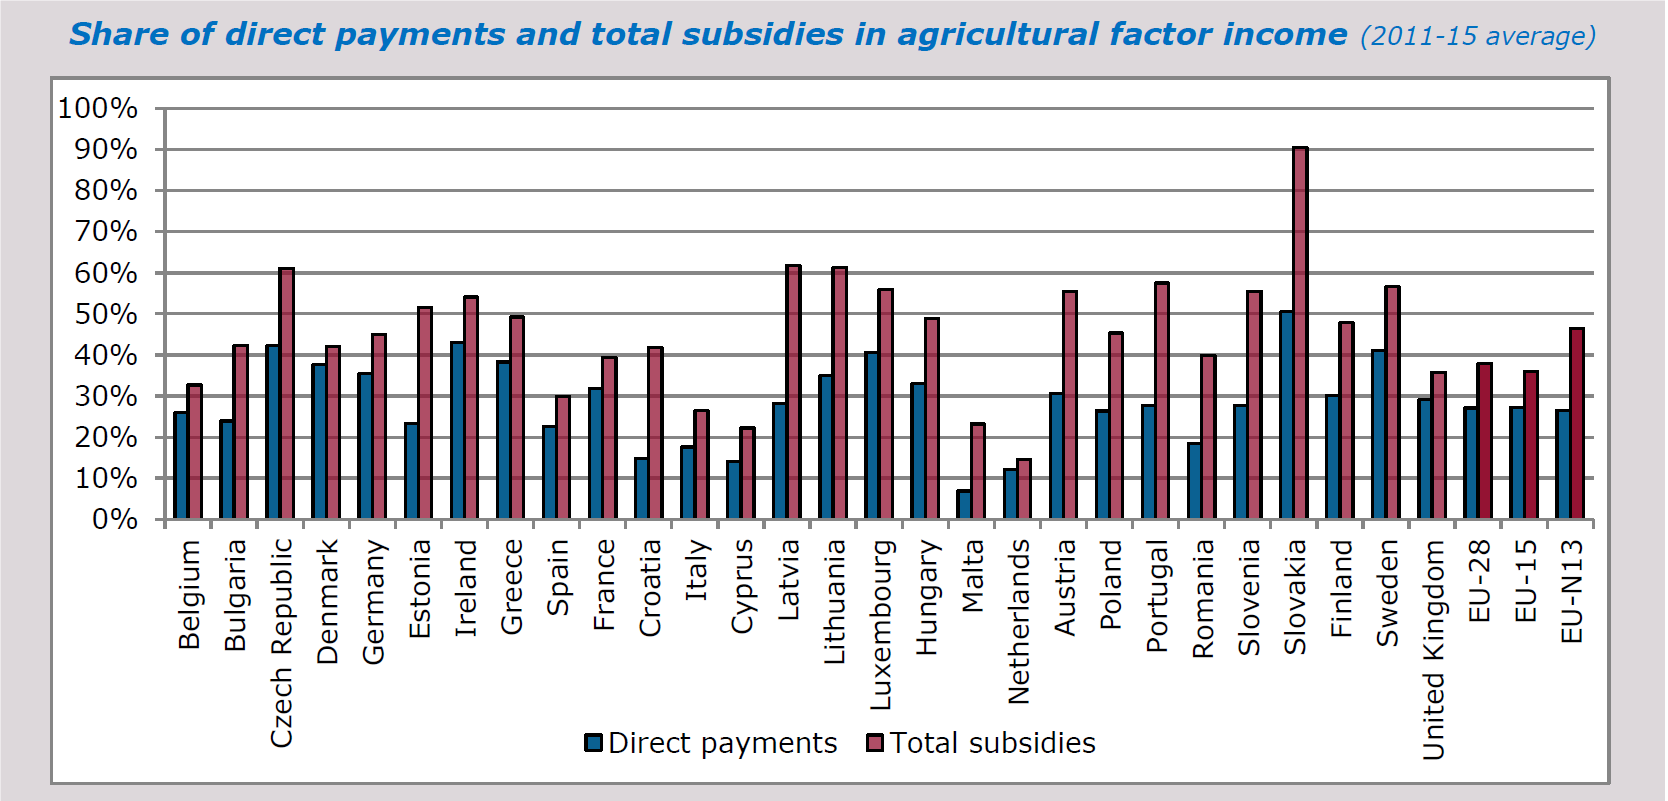
The DG AGRI indicator is presented on the Charts page in the Analysis section of its website and shows two variables. The first is defined as the ratio of direct payments to agricultural factor income. This ratio uses CAP expenditure data on direct payments taken from the EAGF Financial Report and factor income from the Eurostat Economic Accounts for Agriculture. The second variable is total subsidies as a share of agricultural factor income. The latest version of this indicator (accessed 7 January 2019) is shown below.
The basis for the figures in the DG AGRI indicator is not fully clear (the chart contains a link to further information but this does not lead to any source that sheds more light on this). My presumption is that the ‘total subsidies’ figure is calculated using Eurostat data in the way I explain for the Eurostat indicator below given the similarity in the results, and thus should more accurately be labelled ‘operating subsidies’. It would be helpful to have this clarified.
Based on this indicator, DG AGRI concludes:
EU producers are highly dependent on public support (e.g. direct payments, rural development). The EU average share of direct payments in agricultural factor income in 2011-2015 stood at 27%. However, this masked considerable differences between Member States, ranging from 15% or less in Croatia, Cyprus, Malta and the Netherlands to more than 40% in the Czech Republic, Ireland, Luxembourg, Slovakia and Sweden. Taking all subsidies into account, total public support in agricultural income reached 38% of agricultural income on average in the EU.
While the graph is very insightful, it has two drawbacks. First, it is dated (the current version accessed 7 January 2019 shows the indicator averaged for the years 2011-2015). Second, DG AGRI does not maintain its indicators as a time series. We come back to these points after reviewing the other indicators.
The FADN indicator
This indicator is presented in the DG AGRI FADN Farm Income reports, of which the latest is for the 2015 year with preliminary data for 2016. The reports present direct payments (coupled plus decoupled direct payments) as a ratio of both farm receipts and farm net value added (FNVA, which is the same as agricultural factor income).
The FADN reports present the data by Member State, as in the following diagram which shows the ratio of direct payments to factor income in 2015. In 2015, direct payments on average accounted for 30% of FNVA in the EU-28, the same percentage as in 2014. This average cannot be compared directly to the DG AGRI dependency ratio for direct payments of 27% for the EU-28 as the latter is averaged over four years 2011-2015, but the comparison is close. Direct payments expressed as a percentage of FNVA was highest in Slovenia (71 %), followed by Finland (69 %), Slovakia (62 %) and Estonia (51 %). By contrast, direct payments accounted for only 11 % of FNVA in the Netherlands, which showed that the country was more focused on less subsidised sectors, such as horticulture and the production of pigs and poultry.

A strength of the FADN indicator is that it is the only source we have that shows the dependence on direct payments of different types of farming. Direct payments represent a substantial share of FNVA (42-50%) in farms specialised in grazing livestock, mixed crops and field-crops. On the other hand, direct payments play only a limited role in sustaining income within the wine and horticulture sectors. Using the Public Database, it is also possible to derive estimates at NUTS2 regions and by farm size.

For other interesting uses of the FADN indicator, see Figures 9 through 13 in this DG AGRI report Facts and Figures on Direct Payments published in February 2018. These graphs show the dependence on direct payments by physical farm size, by type of farming with estimated 2019 direct payments, and an interesting representation of operating subsidies (which combines rural development expenditure except for investment support with direct payments) by intensity class of farming. In that chart (Figure 13), the level of intensity is measured in terms of the intermediate consumption cost per hectare of Utilized Agricultural Area (UAA). The results show that the more intensive the farm, the higher the direct payment per hectare. However, the share of direct payments in income is higher for the extensive classes than in very intensive classes.
The FADN indicator is thus characterised by its great flexibility. Indeed, using the Public Database, an outside user can construct dependency ratios over time for farm groups by physical size, economic size, farming type, region or Member State.
DG AGRI chooses to present both its own indicator and the FADN indicator as the ratio of support to factor income. As noted earlier, factor income is the amount available to remunerate all factors of production (land, labour and capital, both external and own factors). DG AGRI argues that agricultural factor income “is appropriate for evaluating the impact of changes in the level of public support (i.e. direct payments) on the capacity of farmers to reimburse capital, pay wages and rents as well as to reward its own production factors. This income indicator allows comparison between Member States, because the share of own and external production factors often differs significantly between Member States”.
Nonetheless, farm family income (or entrepreneurial income, as it is called in the Eurostat economic accounts for agriculture), or the amount available to remunerate just the own factors of production, is a relevant concept for farm families. It is the amount that is available to the family in any particular year to support their own living standard while putting aside reserves (depreciation) to renew own capital. Thus, it can also be useful to compare direct payments or total subsidies to farm family income. While this is not done in the Farm Economic reports, these ratios can be calculated by outside users using the Public Database (for an example, see my blog post here where I show that operating subsidies amounted to 62% of farm family income over the 2004-2013 period).
There are three main downsides to the FADN indicator. The first is that, as reported in the Farm Economics reports, only direct payments but not rural development payments are included in the definition of support. As I have just pointed out, this is not a major limitation in practice as the additional rural development payments data are in the Public Database and separate calculations can be made by the outside user. We saw above that DG AGRI has also used the broader concept of operating subsidies with FADN data when looking at the distribution of support across farms by level of intensity.
Second, the DG AGRI FADN unit does not maintain a time series for this indicator though, again, this can be calculated by an outside user using the Public Database.
A third potential limitation is that the FADN numbers are based on a survey of commercial farms in the EU. The survey includes around 80,000 holdings representing around 4.7 million commercial holdings in the EU, when there are 10.3 million holdings in total. However, the sample farms represent around 90% of the total utilised agricultural area (UAA) and account for about 90% of the total agricultural production. So this should not be a major source of bias in scaling to results for the sector as a whole.
The fourth downside is again the delay in publication. As of today (7 January 2019) only the 2015 data are fully validated and used as the basis for a Farm Economics report, although provisional 2016 data are available in the Public Database.
The derived OECD indicator
The OECD Producer Support Estimate (PSE) indicator is very well known. It is defined as the annual monetary value of gross transfers from consumers and taxpayers to support agricultural producers, measured at farm gate level, arising from policy measures, regardless of their nature, objectives or impacts on farm production or income. It is usually expressed as the percentage PSE, defined as the ratio of the PSE to the value of total gross farm receipts, measured by the value of total farm production (at farm gate prices), plus budgetary support.
Our interest is the ratio of gross transfers to farm income rather than farm receipts, whether measured as factor income or entrepreneurial (farm family) income. The OECD PSE data is available online in a fully disaggregated format, which allows these income dependency ratios to be calculated, using the Eurostat income figures from the Economic Accounts for Agriculture.
The figure below shows the derived OECD indicator, defined as operating subsidies relative to either factor income or entrepreneurial income, for the 2005-2017 period. To arrive at operating subsidies from the PSE amount, items A1 Market price support, B2, Subsidies to investment in fixed capital formation and B2 On farm services in the PSE database have been omitted. Note that the OECD indicator includes item B1 Subsidies on variable input use.
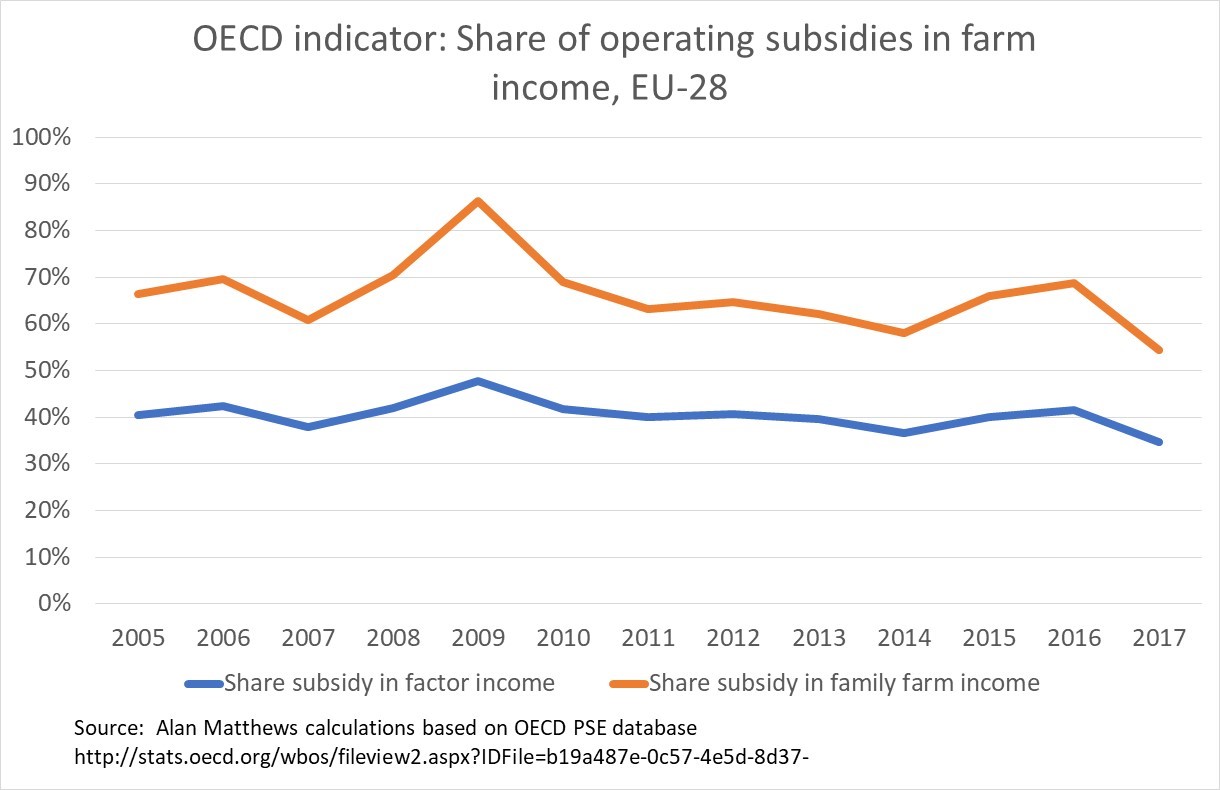
On average, operating subsidies make up 40% of agricultural factor income and 66% of farm family income over the 2005-2017 period. The 40% share can be compared to the DG AGRI indicator for total subsidies relative to factor income of 38% for the 2011-2015 period, showing a close correlation. The OECD dependency share of 66% in farm family income also matches closely with the extended FADN indicator that I had previously calculated (a share of 62% over the period 2004-2013.
The OECD indicator is the first indicator where we have shown a time series (this can be done for the FADN indicator using the Public Database). For both variables, there has been a tendency for the rates of dependency on public support to fall. For factor income, the subsidy share fell from 42% in 20015-2009 to less than 39% in 2013-2017. The corresponding subsidy shares in farm family income fell more sharply from 71% to 62%. This latter trend reflects a steadily rising farm family income in nominal terms while operating subsidies have been stable.
The OECD indicator has the advantage that it is quite timely, as it is usually available in June of the following year. It is also the only source that allows transfers to be calculated at the individual commodity level (the FADN indicator is only available for farm systems/types) through its Single Commodity Transfer indicators. It suffers from one major drawback: it is only available for the whole EU and not for individual Member States. Fortunately, the derived Eurostat indicator can take up this challenge.
The derived Eurostat indicator
The derived Eurostat indicator (or Eurostat indicator, for short) is based entirely on the Economic Accounts for Agriculture and consists of two elements: subsidies on products, and other subsidies on production. The former are subsidies that are directly linked to products, such as coupled payments, while ‘other subsidies on production’ refers to any other subsidies paid to farmers not linked to products, such as decoupled payments, wage subsidies, interest subsidies, environmental payments, less favoured area payments, over-compensation of VAT and disaster relief payments. Unlike the OECD indicator, the Eurostat subsidies figures do not include subsidies on intermediate consumption which are recorded at purchaser prices in the agricultural accounts.
The advantage of this indicator is that it is timely (we can already calculate results for 2018 at the time of writing on 7 January 2019), it is easily available as a time series and it can be calculated for individual Member States. The omission of subsidies on intermediate inputs is a notable drawback. As previously noted, this indicator is reported in the DG AGRI chart, but only for a point in time.

The Eurostat indicator shows a striking similarity to the OECD indicator over time, though it averages a little lower (probably due to the inclusion of subsidies paid on intermediate inputs in the latter indicator). Its subsidy dependency share in farm family income for the period 2005-2017 (ignoring 2018 to compare a similar time period) is 62% compared to the OECD indicator ratio of 66%. Its subsidy dependency share for factor income is 38% compared to the OECD indicator of 40% (note that this corresponds exactly to the DG AGRI indicator for total subsidy in factor income reported previously albeit for the shorter period 2011-2015). Also, the same downward trends are observed. For the share of operating subsidies in factor income, the share fell from 40% in 2005-2009 to less than 36% in 2013-2017. The similar shares for operating subsidies in farm family income were 67% and 57%, respectively.
Conclusions
The main conclusion of this post is that, despite the different methodologies and definitions of public support, the various measures are very consistent and there is a very high level of agreement between them. Based on the Eurostat indicator, public transfers currently (average 2014-2018) make up around 35% of agricultural factor income and 57% of farm family income.
It also appears, based on the novel time series data presented in the post, that there has been a slow reduction in the dependency of farm income on public support over the past decade.
Does this matter for policy-making? People will take different inferences from these figures. For some, the high dependence on public support and its falling share will strengthen the determination to maintain and increase the size of the CAP budget, as the new figures underline even more the role public transfers play in supporting EU farm income.
For others, the figures will underline the unsustainable nature of farm policy-making which has failed to provide a pathway which would allow the farm sector to stand on its own feet. Whichever side of the argument one is on, the factual basis should be clear.
This leads me to two recommendations. The first is that the dependency of farm incomes on public support using the derived Eurostat indicator should be made a context indicator for the CAP and meaured and reported in the context of preparing the CAP Strategic Plans. The public should be aware of the extent to which farm incomes are dependent on public support, and in my view it should be an objective of the CAP Plans to reduce this dependence over time.
However, for this to be meaningful, it would be necessary to further breakdown the category of ‘Other subsidies not related to production’ in the Economic Accounts for Agriculture. What is needed is a breakdown of this category into payments that are intended just as transfer payments to support farm income and payments that are intended to pay for public goods. This distinction will become increasingly important as schemes are developed to remunerate farmers for the provision of public goods and ecosystem services using public money. What we would like to be able to measure is the extent to which these ‘good’ subsidies are replacing and substituting for generalised income support.
Considerable work is being done by Eurostat and national statistical offices on developing environmental accounts which would hopefully provide a basis for making this distinction.
As an example, a blog post by Olaf Hietbrink of Wageningen Economic Research (WUR) referred to the services provided by nature-inclusive agriculture and the potential that providing nature services (ecosystem services) might have to deliver an additional income stream for farmers. WUR has been asked to measure the revenue development of multifunctional agriculture by the Dutch Ministry of Agriculture, Nature and Food Quality. This seems to me the right way to go.
This post was written by Alan Matthews.
Photo credit: Wikipedia
