
In spite of the substantial reforms in the structure of the CAP over the past two decades, EU agriculture remains hugely dependent on public support. The importance of public transfers, including direct payments, to EU farmers can be shown in various ways. One indicator is the importance of direct payments relative to the value of total output in the total revenue of farms (used by DG AGRI in this report on EU farm income). We can also focus more directly on the role that public transfers play in sustaining farm income. Here, there are two possibilities depending on the definition used for farm income – whether this is taken as factor income or entrepreneurial income (using the definitions in the Eurostat Economic Accounts for Agriculture, EAA).
Public support in agricultural factor income
DG AGRI on its website maintains a regularly-updated chart showing the dependence of agricultural factor income on public support from the EU budget ((e.g. direct payments, rural development) by member state. The current chart covering the years 2010-2013 is shown below (all charts can be enlarged by clicking on them).
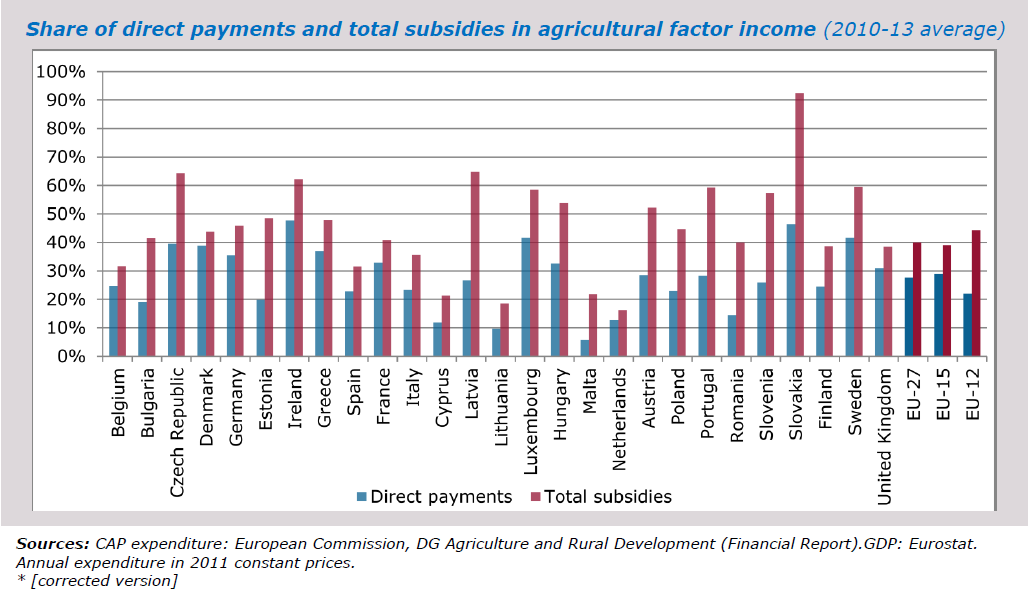
Source: DG AGRI, http://ec.europa.eu/agriculture/cap-post-2013/graphs/graph5_en.pdf, March 2015
Agricultural factor income represents income generated by farming which is used to remunerate (1) borrowed/rented factors of production (capital, wages and land rents), and (2) own production factors (own labour, capital and land). DG AGRI argues that this concept of income is appropriate for evaluating the impact of changes in the level of public support on the capacity of farmers to reimburse capital, pay wages and rents as well as to reward its own production factors. This income indicator allows comparison between member states, because the share of own and external production factors often differs significantly between member states.
EU producers are highly dependent on public support. The EU average share of direct payments in agricultural factor income in 2010-2013 stood at 28%. However, this masked considerable differences between member states, ranging from 15% or less in Cyprus, Lithuania, Malta, the Netherlands and Romania to more than 40% in Ireland, Luxembourg, Slovakia and Sweden. These differences reflect the specialisation of member states in different sectors as well as differences in the historical basis of payments. Taking all subsidies into account, total public support from the EU budget in agricultural income reached 40% of agricultural income on average in the EU.
Public support in farm income using FADN data
It is also possible to assess the importance of public support including direct payments using microeconomic data on individual farms based on the Farm Accountancy Data Network (FADN) database (I previously looked at the role of public support using FADN data in this post). The scope of the FADN survey covers only farms whose size exceeds a minimum threshold so as to cover the most relevant part of the agricultural activity of each member state, i.e. at least 90% of the total Standard Gross Margin (SGM) and 90% of Utilised Agricultural Area covered in the Farm Structure Survey (FSS). For 2012, the sample consisted of approximately 83,000 holdings in the EU-27, which represented nearly 5.0 million farms (40%) out of a total of 12.2 million farms included in the FSS. The rules applied seek to provide representative data for three criteria: region, economic size and type of farming. The FADN is based on harmonised accounting principles which are the same in all EU member states.
The FADN database contains two income concepts equivalent to the Eurostat EAA. Farm net value added (FNVA) is equal to gross farm income minus costs of depreciation. It is used to remunerate the fixed factors of production (labour, land and capital), whether they are external or family factors, and corresponds to the EAA concept of agricultural factor income. Farm net income (FNI) is derived by subtracting remuneration of the external factors of production from the farm net value added and by adding the balance of subsidies and taxes on investments. It shows the remuneration of family labour, own land and own capital, and corresponds to the EAA concept of entrepreneurial income.
As DG AGRI argues, the FNVA indicator allows comparisons across farms regardless of the family/non-family nature of the factors of production used. However, it is the amount left over after paying for external factors of production which concerns the majority of farm families in the EU. So I have elected to use the farm net income indicator to assess the relative importance of public support across the EU using the FADN data. Other factors equal, this indicator will give a greater emphasis to the role of direct payments and public support generally in farm incomes.
However, there are other important differences between the DG AGRI chart using EAA and CAP expenditure data and the FADN results shown in the charts below. The FADN data include payments received from member states in addition to payments received from the EU budget. These payments may be compensatory national direct payments used to top-up Pillar 1 direct payments during a transition period in the new member states, national co-financing of rural development programmes, or other types of state aids.
Also, the FADN sample consists only of commercial farms although it covers around 92% of EU farm income as measured using the EAA (the exact percentage varies from year to year). To the extent that member states have opted to exclude very small farms from direct payments, this would also tend to raise the aid intensity on farms in the FADN sample above the average shown using EAA data.
On the other hand, only public transfers which are linked to current operations are included, thus excluding subsidies on investments which are significant in some countries (and which are included in the definition of farm net income).
In the following charts, total farm net income is partitioned between direct payments (both coupled and decoupled), other public support, and income depending on market factors (market income) which is defined as the residual. This partitioning is based on the strong assumption that all of the expenditure on intermediate consumption and external factors is allocated to the production of marketed output, and that the current level of public subsidies would be fully retained even if the farm reduced expenditure on intermediate inputs and external factors to zero.
This is undoubtedly a crude exaggeration. For example, a farmer may be renting land on which he or she is drawing a Basic Farm Payment. Without the rental payment the farmer would not receive the direct payment. Coupled payments obviously require production. Some minimal expenditure would be required to maintain land in Good Agricultural and Environmental Condition. There are also interdependencies between the different income categories. For example, an increase in direct payments will be partly capitalised into higher land rents. This would mean higher payments to external factors and therefore a lower market income. Conversely, reducing direct payments would be expected to raise market income for the same reason. However, despite these caveats, this partitioning provides useful insights into the dependence of different types of farming on the different components of income.
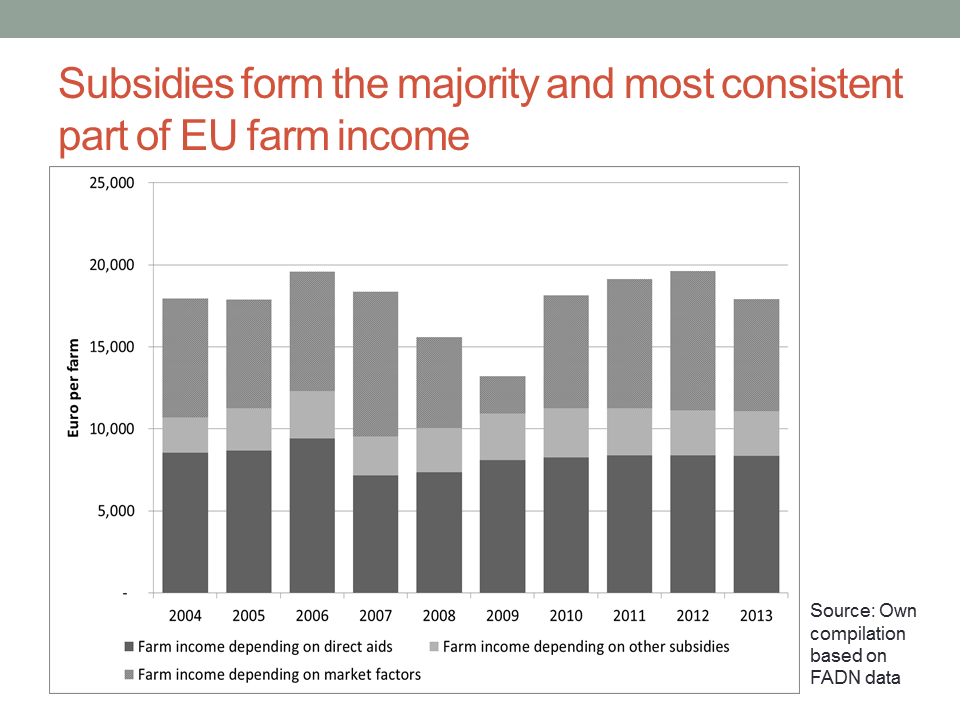
The next chart shows the evolution of this partitioning of farm net income over time. Over the full period 2004-2013, direct payments have accounted for 47% of farm net income, other public transfers 15%, and market income the remaining 38%. Direct payments have been the most stable component of farm net income, as shown by the respective coefficients of variation (0.08 for direct payments, 0.09 for other public transfers and 0.27 for market income)
The importance of public transfers differs greatly across farm systems. In this and the later charts, I have calculated a three-year average using the last three years of FADN data in order to smooth out year-to-year variations.
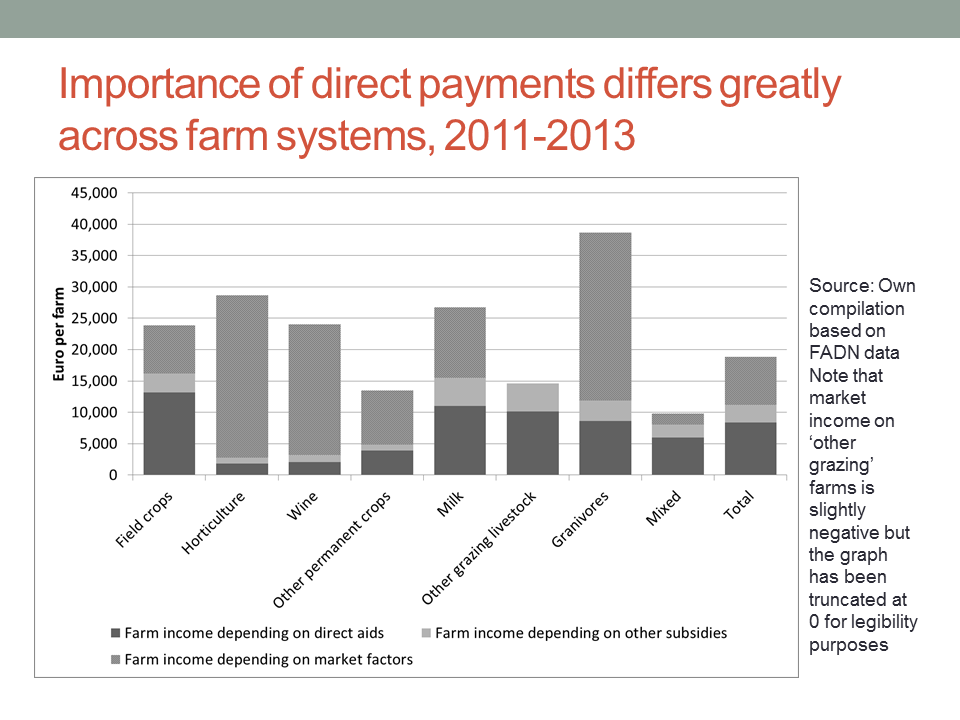
Direct payments play a relatively minor role on horticultural farms (7%), vineyards (9%) and pig and poultry farms (granivores) (22%). However, they account for 70% of the income on ‘other grazing livestock’ farms (predominantly beef and sheep) and 61% on mixed farms. Taking account of other public transfers does not change this ranking. The largest amounts in absolute terms are obtained by milk and ‘other grazing livestock’ farms. Indeed, for the latter group, total public transfers (101%) actually slightly exceeded farm net income (the negative market income is not shown on the chart for legibility reasons).
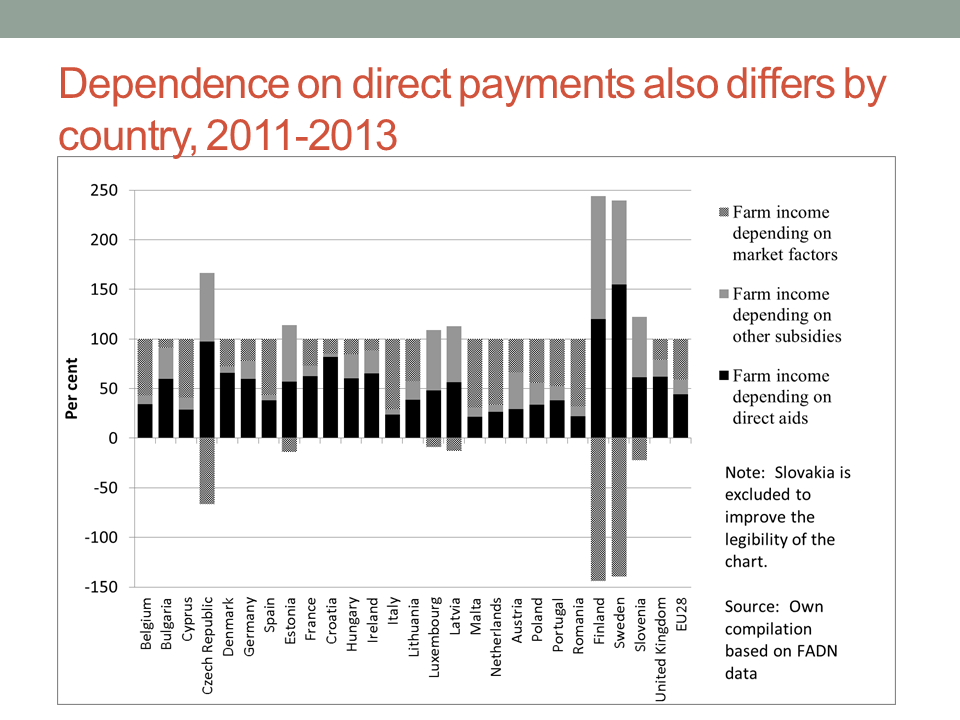
Finally, the importance of public transfers in farm incomes by member state is shown in the final chart. Unlike the previous charts which showed absolute amounts, this chart shows the relative shares. There are a number of member states with negative market income during this period (although only in Slovakia was overall farm net income negative – for this reason it is not shown on the chart). Countries with negative market income include some newer member states (where corporate agriculture is important) but also Finland, Sweden and Luxembourg.
The figures for Sweden and Finland stand out as they show a much greater dependence of farm net income on direct payments and public support than in the DG AGRI chart shown first in this post. This is partly because of the importance of national payments to farmers (not included in the DG AGRI chart) but also because of high payments to external factors, which makes for a big difference in the denominator whether factor income or farm net income is used. These data also do not reflect the impact of the Russian embargo which has resulted in a further sharp decline in the value of entrepreneurial income in Finland in 2014 and 2015.
Conclusions
Despite successive CAP reforms, it is clear that EU agriculture continues to be hugely dependent on public transfers. Indeed, these charts only show the role of budgetary transfers. Although much smaller than in the past (see this post), there continue to be transfers made to producers directly by consumers in the form of market price support. So total support to producers is even higher than these charts suggest.
A small share of this total support can be justified as payments for public goods, particularly environmental services. But the great bulk of this support is simply income support for farmers. Is this high dependence on public support a healthy position for EU agriculture to find itself in?
There are two schools of thought in answering this question. One school views EU agriculture as inherently uncompetitive but which deserves support because of its contribution to various social objectives (summarised in the multifunctional role of EU agriculture). From this perspective, the high dependence of EU agriculture on public support is a triumph for political decision-making. The main challenge for the future is seen as maintaining the flow of funds to farmers through the CAP budget and national state aids.
The other school of thought sees the high dependence of EU agriculture on public support as strong evidence for the failure of past EU agricultural policy. The objective of policy should be to equip farmers to address the challenges they face, whether from market volatility, in providing public goods, in taking advantage of new opportunities (including in bioenergy) or in coping with climate change. From this perspective, the failure to design a policy which would gradually wean farmers off untargeted public support is a serious error. In particular, direct payments which were originally introduced to compensate farmers for reductions in high levels of guaranteed prices are now a permanent part of the system, without any link to specific objectives, despite the efforts made to legitimise them in the last CAP reform.
Whichever camp we are in (and I belong to the second school of thought on this issue), the high dependence on public support leaves farm incomes vulnerable to budget cutbacks. Both EU and national spending on agricultural support has been slowly falling in real terms. Although no radical changes are expected as part of the mid-term review of the current EU Multiannual Financial Framework (MFF) due later this year (for a discussion, see this post), all bets are off when it comes to the Commission’s proposal for the next MFF for the period after 2020 which is due before the end of 2017.
This post was written by Alan Matthews
Photo credit: Rice in the Po valley, courtesy JRC

market deregulation has brought very cheap commodity prices for agro-industry and retailing sector. Public support to farmers, which tries to compensate this, in fact is a subsidy to the downstream sector, allowing farmers to sell them their products at prices below the production costs. Would taxpayers/consumers agree if aware ?