The changing distribution of CAP direct payments over time

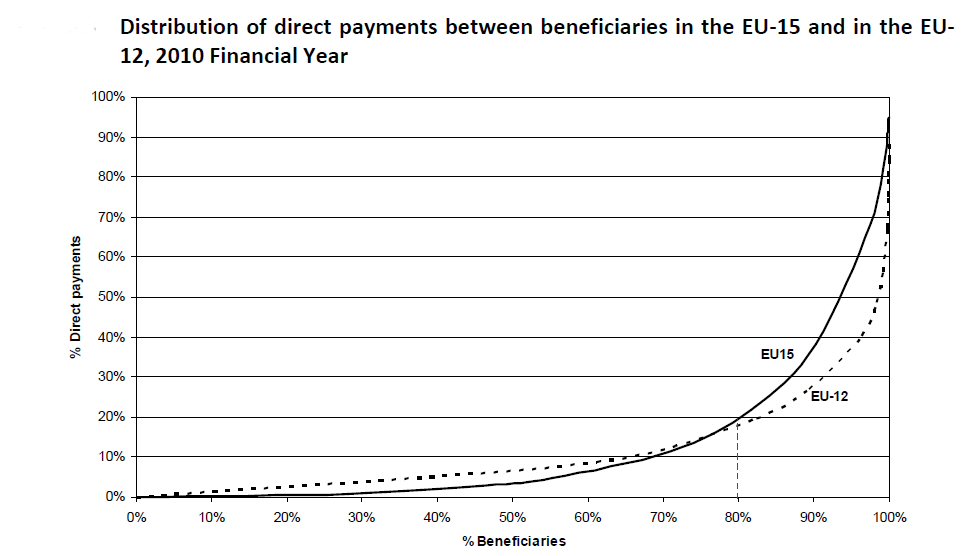
The distribution of CAP direct payments among farmers has been a continuing source of controversy ever since the Commission’s 1991 Reflections Paper on the development and future of the CAP that prefigured the MacSharry reform noted that 80% of the support provided by FEOGA is devoted to 20% of farms which account also for the greater part of land used in agriculture. In successive CAP reform proposals the Commission has proposed measures that would allocate CAP support more evenly across farms, including in its 2018 legislative proposal for the CAP 2021-2027. On each occasion, the Council has pushed back and weakened the Commission proposal, as also happened with the outcome for the CAP post 2023 (the debate on redistribution in the 2018 reform is reviewed in this report for the European Parliament, chapter 5).… Read the rest

Capping direct payments – a modest proposal

DG AGRI has published its latest breakdown of the distribution of direct payments in financial year (FY) 2017, which refers to payments made to farmers in the claim year (CY) 2016. The report itself has less text than usual, but lots of graphs showing the distributions of payments and recipients for the EU28 and by country. The detailed tables showing the numbers behind these graphs are given in the statistical annex.

A couple of points are worth remarking. The tables distinguish between the distribution of decoupled payments, other direct payments and total direct payments. The decoupled payments include the basic payment, greening payment, redistributive payment, young farmers’ payment, and the payment to areas facing natural constraints in Pillar 1.… Read the rest

The redistributive payment is more effective at redistribution

Capping of direct payments is not the only instrument proposed by the Commission to allocate more support to small and medium-sized farms. In addition to a mandatory ‘basic income support for sustainability’, the Commission CAP proposal would also require Member States to introduce a ‘complementary redistributive income support for sustainability’. This redistributive payment is currently voluntary under the 2014-2020 CAP.

Under the current CAP, the redistributive payment is applied by 9 Member States: BE-Wallonia, BG, DE, FR, HR, LT, PL, RO and UK-Wales. The financial allocation to the scheme takes up from 0.5% to 15% of the Member States national ceiling for direct payments.… Read the rest

Focus on the distribution of direct payments

Each year, the Commission presents a report on the distribution of direct aids to agricultural producers (links are provided on this web page). In this report, the Commission presents the breakdown of direct payments by Member State and size-class of aid. It is the source for the graphs which compare the cumulative amounts of payments with the cumulative number of beneficiaries.

The graph from the most recent report for the 2014 financial year (thus covering direct payments made to farmers in 2013 as Member States are reimbursed in the following financial year) is shown below. It confirms that the oft-quoted statistic that 80% of direct payments go to just 20% of farmer beneficiaries is alive and well; indeed, the distribution is even more skewed in Bulgaria and Romania than in other Member States.… Read the rest

The distribution of CAP direct payments

DG Agri recently published its latest report on the distribution of direct payments to farmers within the EU for the financial year 2012 (the payment year 2011). The payments covered are the Pillar 1 direct payments, but not payments under Pillar 2 or the national top-ups paid in the new member states.

The report also provides comparative information with the financial year 2005 (payment year 2004) which is the first year in which farmers in the 10 new member states received direct payments; for Bulgaria and Romania, comparisons are made with the financial year 2008 (payment year 2007) which corresponds to the first year in which their farmers received payments following their accession.… Read the rest

The distribution of CAP payments by member state

The Scottish Government is currently waging a campaign for a higher share of the UK national envelopes for Pillar 1 and Pillar 2 of the CAP. It claims that Scotland is almost certain to find itself at the bottom of the EU per hectare league table in terms of both Pillar 1 and Pillar 2 support by the end of the next CAP period because, as a region, it could not directly benefit from the ‘external convergence’ formula used to increase payments in those countries with currently low payments per hectare.
As part of its campaign, the Scottish Government has prepared two tables showing the levels of payment per hectare for both Pillar 1 and Pillar 2 in each member state currently and on average over the 2014-2020 MFF period to bolster its case.… Read the rest

Implications of the new redistributive payment

Ever since direct payments were introduced into the CAP, their unequal distribution has attracted unfavourable attention. The Commission’s 1991 paper The Development and Future of the CAP criticised the distribution of price support, noting that “80% of the support provided by FEOGA is devoted to 20% of farms which account also for the greater part of the land used in agriculture”. Yet the proportions remain exactly the same in both the EU-15 and EU-12 today, according to the Commission’s latest figures for the claim year 2009 (financial year 2010) (see diagram).

Even for those who argue that the specific nature of farming justifies a permanent system of direct payments support, the unequal distribution of support is hard to justify.… Read the rest