DG Agri recently published its latest report on the distribution of direct payments to farmers within the EU for the financial year 2012 (the payment year 2011). The payments covered are the Pillar 1 direct payments, but not payments under Pillar 2 or the national top-ups paid in the new member states.
The report also provides comparative information with the financial year 2005 (payment year 2004) which is the first year in which farmers in the 10 new member states received direct payments; for Bulgaria and Romania, comparisons are made with the financial year 2008 (payment year 2007) which corresponds to the first year in which their farmers received payments following their accession.
I reproduce here some of the graphs in the report which highlight its major conclusions. The report points out that looking at trends over time at the aggregate EU-25 or EU-27 level does not make sense, for two reasons. First, the 2007 enlargement brought a large number of very small farms into the EU which caused a one-off shift in the EU average payment and the payment distribution.
Second, during the period covered, direct payments were still being phased in in the new member states (they reached 90% of the agreed maximum for the EU-10 and 60% for Bulgaria and Romania in 2012). For this reason, the report focuses on the trends for the EU-15, EU-10 and EU-2 separately.
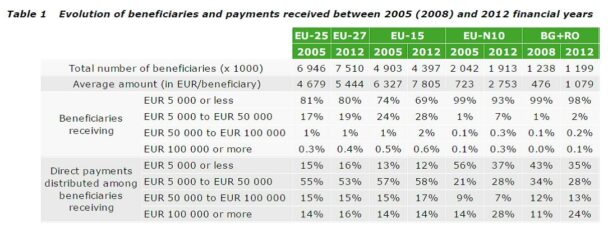
The distribution of payments is shown in tabular form in the table below. For interpretation purposes, it is easier to discuss the distributions in graphical form.
Note that, despite the share of payments in amounts below €5,000 falling in each of the three regions, the share of these payments in the total EU increased slightly, reflecting the enlargement issue and the phasing in payments in the new member states.

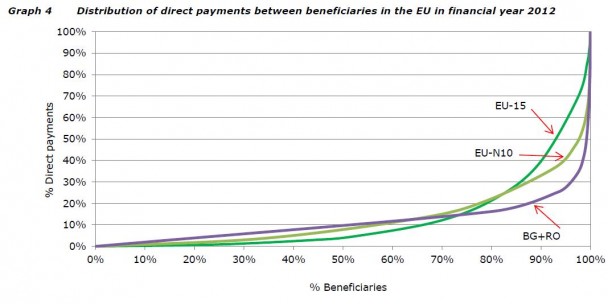
First, it is interesting to compare the distribution of payments within each of the three regions, shown in Graph 4 extracted from the report. The curves are interpreted as showing the cumulative proportion of direct payments received by the cumulative proportion of beneficiaries (they are called Lorenz curves after the US economist who first used them to describe income inequalities).
For example, in both the EU-15 and EU-10, the approximately 80% of the beneficiaries with the smallest payments received just 20% of all payments; in the EU-2, the proportion of payments received by this group was around 15%. If every farmer received exactly the same payment, then the Lorenz curve would be a 45-degree straight line through the origin. The greater the degree of deviation of a Lorenz curve from this imaginary straight line, the greater the degree of inequality in the distribution of payments.
Because the curves cross, one cannot say unambiguously that the distribution is more equal in one region than in another. In the EU-2, the 50% of beneficiaries with the lowest payments receive more than twice as large a share of the total payments than in the EU-15 (though still less than 10%). However, this is offset by much greater inequality in the distribution of the larger payments. In the EU-2, just 12% of the farms with the largest payments receive 80% of the total payments; in the EU-15 it is 20% of the farms with the largest payments which share 80% of the total payments.

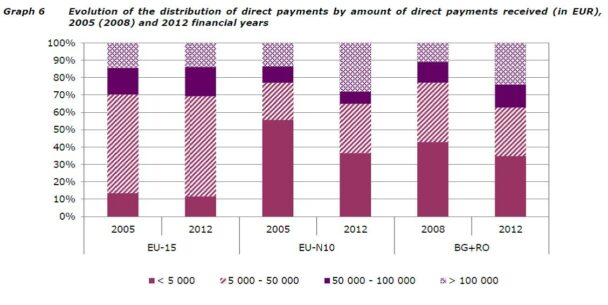
Graph 6 from the report (shown below) illustrates this from another angle. The importance of payments less than €5,000 is much greater in the EU-10 and the EU-2 compared to the EU-15. However, the share of total payments accounted for by payments less than €5,000 has fallen sharply in the new member states. This is because of more rapid structural change but also because the phasing in the payments raised the payments received by each farm and lifted many farms above the €5,000 threshold.

The figures for the EU-15 are not distorted by the phasing-in effect. But they are still the result of two offsetting forces. On the one hand, structural change means fewer smaller farms and, other things equal, a fall in the share of the smallest payment amounts. On the other hand, with the Health Check reform there was an increase in the compulsory modulation that transferred a proportion of payments above €5,000 to rural development and the introduction of progressive modulation affecting beneficiaries receiving payments over €300,000.
The effect of modulation was just sufficient to offset the expected impact of structural change, such that for the EU-15 the share of the largest payments (those greater than €100,000) in total payments was exactly the same, at 14%, in both 2005 and 2012. This is in contrast to both EU-10 and EU-2 where the proportion of the total payments accounted for by these very large payments increased.
DG Agri claims in the report that, as a result of the CAP2013 reform, the distribution of direct payments will be ‘fairer’ in the coming programming period. However, as Professor Stefan Tangermann has argued in a note for the European Parliament, more equal is not necessarily the same as more equitable:
Whether a given distribution of public aids is considered equitable depends not on whether each recipient receives the same amount from the public purse, but on whether it is in line with relative needs. The need for income support depends on the actual income situation of the recipient. If a farmer with a high income receives the same payment as a farmer with a low income, equity is not achieved. Thus, in order to become really equitable, the basic component of direct payments (and possibly also the “greening component”, though it is supposed to address different goals) would have to be distributed on the basis of a means test of all potential recipients. This is obviously not intended as the payments will continue to be made, it must be assumed, on a per hectare basis. As that is the case, and in the absence of a distribution key related in some way to actual farm income, there is no reason to assume that any given distribution across Member States is fundamentally more equitable than any other distribution.
This post was written by Alan Matthews.
Photo credit: Geograph UK used under a Creative Commons licence.


I think the missing element of discussion is objectives. There is actually no moral or economic argument to suggest that larger farmers should not claim more subsidy. Larger farmers employ more people (often people with fewer resources than smaller farmer claimants) and economically large farmers should at least not to be discouraged by a reduction in subsidy from expansion if economically justified. The original CAP objective was to increase return to labour and 5m farmers were expected to leave the industry. This objective is no longer so clear. The UK and particularly England tends to be out on a limb – we have large farm size but no depopulation of the countryside and a more even return between rural and industrial sectors. Our problem is far more basic – the greening proposals are vastly inferior to the programmes in existence and the crop diversification policy increases cost for no environmental gain.