
The 2019 EU Trade Policy Review was recently published by the World Trade Organisation (WTO). The trade policy review process takes place every two years for major economies and is an important transparency tool. The country under review produces a policy report summarising major trade policy developments since the last review. A second report is written independently by the WTO Secretariat. These reports are then discussed by the full membership in the WTO’s Trade Policy Review Body. Indeed, the EU received more than 1,600 written questions from other WTO members on these reports to which it has provided written answers (unfortunately, the latter files are restricted and not publicly available on the WTO website).
The Secretariat’s report is a useful source of data and includes a section on agricultural tariffs. Most of the attention to agricultural policy in the EU in the past two years has been directed to domestic support in the context of the proposed changes to the CAP framework for the period after 2022. The publication of the Trade Policy Review reminds us of the continuing importance of agricultural trade policy in protecting the EU market and supporting farm incomes.
Agricultural border protection is no longer as tightly linked to agricultural policy as it was in the days prior to the MacSharry reform in 1992 and particularly the conversion of variable import levies to fixed tariffs as part of the entry into force of the Uruguay Round Agreement in 1995. After tariffication, DG AGRI was no longer responsible for the level of agricultural tariffs (Swinbank, 2018). Import duties on cereals and some fruits and vegetables are exceptions to the fixed tariff rule where the tariffs charged are a function of the import price, the former due to the Blair House Agreement between the US and the EU in 1992 and the latter due to the entry-price system used to establish the tariff rate applicable to the import of many fruits and vegetables.
Agricultural tariffs are now part of the EU’s Common External Tariff (CET) and changes affecting them depend more on general trade policy initiatives (for example, free trade agreements with third countries) than on specifically agricultural concerns. Nonetheless, agricultural production in the EU might be quite different if these tariffs no longer existed.
In this post, I look at the level of EU agricultural tariffs and their likely impact in suppressing imports. The most recent evidence, discussed below, is that these tariffs keep agricultural imports between 13-14% below their predicted level in the absence of tariffs. Agricultural imports might be around €20 billion higher if tariffs were eliminated. This is a lower bound estimate as some sectors (such as Animal products and Beverages) had to be omitted due to difficulties in obtaining statistically significant results. The results show that the sectors where import protection has the largest impact include processed foods, tropical products, fruits and vegetables and tobacco. These are not usually the sectors that attract most attention in debates on agricultural trade liberalisation.
Average tariffs on EU agricultural imports
One measure of the protection afforded to agricultural production in the EU is the simple average applied Most Favoured Nation (MFN) tariff for different product groups. The term ‘MFN’ means the tariff that applies to an exporter that does not have preferential access to the EU market either under a free trade agreement or the EU’s non-reciprocal preferential trade regime for developing countries known as the Generalised System of Preferences (which also includes a special duty-free and quota-free access for least developed countries known as the Everything but Arms scheme).
The term ‘simple’ refers to the fact that average tariffs are calculated by averaging the tariff applied to each 8-digit tariff line included in the group, disregarding differences in the level of imports under each tariff line. In practice, the calculation of these simple averages in the case of agricultural products is anything but simple.
This is largely because, unlike non-agricultural goods where nearly all tariffs take the form of percentage or ad valorem tariffs (a percentage mark-up on the value of the imported good), almost half (47%) of agricultural tariffs are non-ad valorem (NAV) tariffs. They can be specific tariffs (a fixed absolute amount regardless of the value of the imported good); compound tariffs (that include both a specific and an ad valorem element); or mixed tariffs (meaning that the tariffs are expressed as either a specific or an ad valorem rate, depending on which generates the most (or sometimes the least) revenue). To calculate a simple average, these NAV tariffs must be converted into ad valorem equivalents (AVEs) by comparing the duty charged to the value of the imported good. As we will see later, there are various ways of doing this.
These simple average MFN tariffs for EU agricultural imports and various product groups are shown in the chart below. There are a number of messages. First, agricultural tariffs on average are more than three times as high as average tariffs on non-agricultural goods (the classification into agricultural and non-agricultural goods is based on the definitions in the WTO Agreement on Agriculture and can differ somewhat from other commonly used classifications). However, agricultural tariffs are not uniform across tariff lines and product groups.
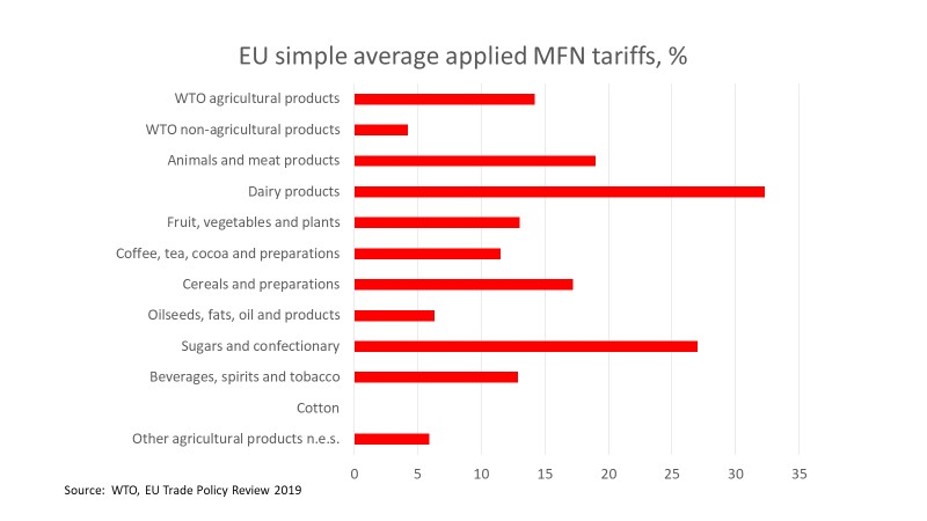
The stand-out sector with the highest average tariffs is the dairy sector (32.3%), followed by sugar and confectionery (27.0%), meats (19.0%) cereals and preparations (17.2%) and fruits and vegetables (13.0%). The dairy sector is interesting because tariffs are usually put in place to protect sectors that are vulnerable to import competition, but the EU dairy sector is a very successful exporter. In fact, the OECD when calculating its producer support estimate for milk in the EU (the single commodity transfer) finds that market price support since 2009 is very low and in many years zero. In other words, contrary to what might be implied by the very high tariffs on dairy products, the price EU milk producers receive is actually very close to the world market price. This is an example of what economists call ‘water in the tariff’ meaning that the tariff is largely redundant – the tariff could be reduced (‘squeezed’) without affecting the market price of the affected commodity.
On the contrary, the tariffs for sugar, meats, cereals and fruits and vegetables do have a protective effect and result in higher prices on the EU market than would exist in the absence of this tariff protection.
These average tariffs also hide a further lack of uniformity in the tariffs applied within each product group. The WTO report shows that tariffs on agricultural products varied between 0 and 171.6%. Tariffs on animal products were as high as 116.6% in 2019, while for dairy products and some fruits and vegetables, individual tariffs were as high as 160%. Indeed, nearly all of the EU’s tariffs above 20% were in the agricultural sector.
It is interesting that there are significant tariffs on coffee, tea, cocoa and preparations even though the EU does not produce the raw commodities. Here the protection is designed to protect processing activities in the EU. For example, the import duty on raw cocoa beans is 0%, on cocoa paste 9.6%, on cocoa butter 7.7%, on cocoa powder not containing sugar or other sweeteners 8.0%, while for chocolate the in-quota (i.e. preferential) rate for the bound TRQ in GATT is 43%.
This is an example of what is called ‘tariff escalation’ where the tariff increases with the degree of processing. It is designed to provide explicit protection to the manufacturers of the processed product. While preferential agreements with African exporters mean they avoid the adverse effects of tariff escalation (as all products enter duty-free regardless of the level of processing), it is hard to understand why the EU insists on protecting large multinationals such as Mondelez, Mars, Ferrero, Lindt & Sprungli and Nestle that benefit from these tariffs.
Is there a right tariff average?
Although EU tariff rates have not changed in recent years, the high share of NAV agricultural tariffs means that variations in unit import prices can give rise to changes in the AVEs of agricultural tariffs. The following table shows the simple average AVEs in recent years. The 2015 and 2019 figures are comparable in that both are taken from the respective EU Trade Policy Reviews for those years. The overall averages for agricultural products are very close, although average tariffs for some products groups went up between the two years and for other product groups went down.
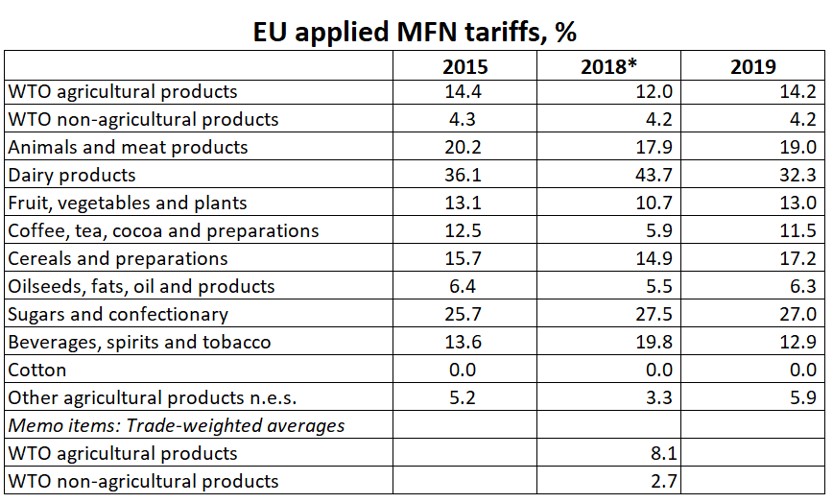
*2018 figures calculated using a different methodology from WTO World Tariff Profiles 2019
The 2018 figure is taken from the WTO World Tariff Profiles publication and the figures are significantly different. The reason is that the AVEs are calculated by the WTO in different ways in the two publications. This is a useful reminder that the figures quoted for average agricultural tariffs not only vary over time but also depend on the calculation method.
Briefly, the difference between the two calculation methods depends on the way in which individual tariffs are aggregated. The WTO Trade Policy Reviews use the EU’s own tariff nomenclature (the Combined Nomenclature) which defines tariff lines at the 8-digit level. The simple average is calculated across all 8-digit tariffs. The WTO Tariff Profiles calculates tariff averages at the 6-digit level. This is because it wants to make comparisons across countries and the tariff classification system that countries use (the Harmonised System, HS) is only common to the 6-digit level. Countries are free to define their own more detailed tariff lines at the 8- and 10-digit levels as the EU does in its Combined Nomenclature.
In the Tariff Profiles publication, all simple averages are based on pre-aggregated HS 6-digit averages. Pre-aggregation means that duties at the tariff line level are first averaged to HS 6-digit subheadings. Subsequent calculations are based on these pre-aggregated averages. This is a subtly different way of averaging compared to averaging directly from the 8-digit level as is done in the Trade Policy Reviews.
Another difference between the two publications is in the way AVEs are calculated depending on how the import unit value is calculated. In the Trade Policy Reviews, AVEs are calculated based on import data (to derive unit values) at the 8-digit level in the Eurostat database. In the World Tariff Profiles, unit values are calculated at the 6-digit level for either reference groups with similar economic and trade profiles or using world import values. The overall impact is to lower the calculated simple average MFN applied tariff on EU agricultural imports from 14.4% to 12.0% with some more substantial differences for individual product groups (for example, Coffee, tea and cocoa products and Beverages and tobacco).
The World Tariff Profiles also provide estimates of average tariffs based on trade weights rather than simple averages. It may seem intuitively sensible that the tariffs for goods that are imported more heavily into the EU should be given a greater weight in calculating the average. However, the trade-weighted average suffers from a severe bias because import flows depend on the tariff in place. The higher the tariff, the less the product is imported. If the tariff is prohibitive, there will be no imports and this tariff will get a weight of zero even though it is very high.
Trade-weighted averages thus tend to be dominated by products facing low tariffs, leading to an underestimation of a given country’s protection level. This is not always the case, for example, if tariff lines with higher tariffs face inelastic demand curves. However, the expected under-estimation effect is confirmed by the World Tariff Profiles data in the table above which shows that the trade-weighted average is well below the simple average for both agricultural and non-agricultural goods.
The role of preferences
Average MFN tariffs on agri-food imports are relatively high but these figures can be misleading, in two respects. First, as many agri-food tariff lines have zero MFN duties, where duties are applied, they are often much higher than the average (for the EU, around 19% of agricultural HS 8-digit tariff lines and 31% of HS 6-digit tariff lines are zero, the difference being explained by the fact that 8-digit lines are used much more often for products where tariffs are applied).
Second, many agri-food imports do not pay the MFN rate due to preferential access arrangements of various kinds. Preferential access can be offered under a free trade agreement. In addition, unilateral non-reciprocal tariff preference are offered to developing countries under the EU’s Generalised Scheme of Preferences which also includes a special arrangement the Everything but Arms scheme for the least developed countries.
Furthermore, the use of Tariff Rate Quotas (TRQs) is very common in agriculture. Around 14% of the EU’s agricultural tariff lines at the HS 6-digit level made use of TRQs. TRQs are dual tariffs where a limited quantity of imports is permitted to enter the EU at a low or zero in-quota tariff, while the normal MFN applied tariff is charged on imports above the TRQ quantity. TRQs reduce the protective impact of the MFN tariff if the quota is not binding (because then the tariff that additional imports would attract is the lower in-quota rate).
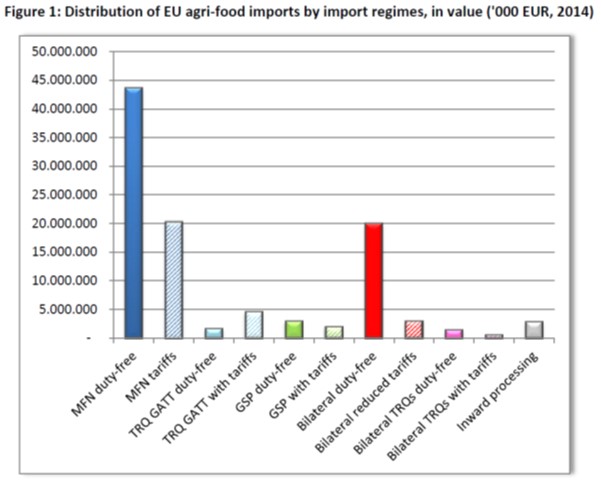
DG AGRI made a special report in 2015 on the distribution of agri-food imports by import regime in 2014 which throws light on the volume of imports under these different trade regimes. The total value of agri-food imports in that year was €104 billion. Of that amount, about 71% entered at a zero rate of duty. Agri-food imports at MFN zero duty represented a value of about €44 billion (43% of all agri-food imports). A further 38% of EU agri-food imports benefited from preferential treatment (duty free or reduced duties), corresponding to almost €40 billion. Only 20% of EU agri-food imports (about €20 billion) entered at full duty, without benefiting from any kind of preference.
Most preferential imports entered under free trade agreements. Smaller amounts entered under the Generalised System of Preferences for developing countries (including the Everything but Arms scheme for the least developed countries), under in-quota TRQs and under inward processing (which exempts EU importers from paying import duties when the imported product is re-exported again after further processing, thus providing EU processors access to raw materials at world prices at times when EU prices are higher).
Towards a better estimate of the true level of agricultural protection
The fact that only 20% of EU agri-food imports pay an MFN duty might suggest that the level of these tariffs is not that important. But if tariffs were lower or did not exist, the volume and structure of imports would change.
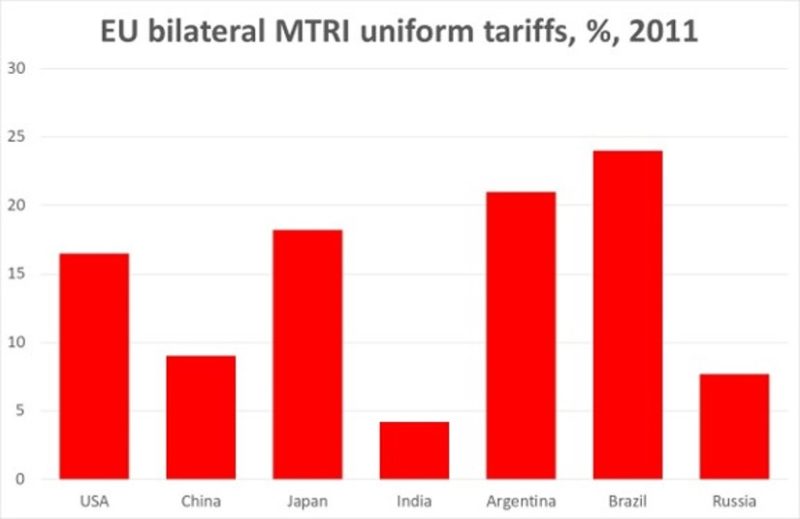
Faced with the complexity of different import regimes and different tariff rates, agricultural economists have pursued a number of lines of enquiry. One way to manage this complexity is to ask, what is the uniform tariff that would result in exactly the same volume of imports as we observe in practice with very differentiated tariffs. Economists call this uniform tariff the Mercantilist Trade Restrictiveness Index (MTRI). It can be calculated for all EU imports, but bilateral uniform tariffs for individual exporters can be calculated on the same principle. Bilateral uniform tariffs will differ from each other because exporters specialise in exporting different commodities that have different levels of protection.
In order to calculate this uniform tariff, we need to know how imports will respond to changes in prices. Calculating this uniform tariff therefore requires the use of an economic model and the final figure will depend on the parameters of this model. The results of one study that calculated bilateral uniform MTRI tariffs for some major exporters to the EU using the GTAP model and with 2011 data are shown in the next chart. Latin American exporters are shown to face the highest tariffs while the average level of tariff protection against imports from China and India is relatively low.
Agricultural economists have also been interested to calculate the trade impacts of the EU tariff regime, bearing in mind that some countries face the standard MFN tariffs while others have preferential access. One of the insights of the recent literature in this area is that the extent to which an exporter benefits from preferences cannot be determined just by comparing the preferential tariff with the MFN tariff. Because of the many different preferential trade arrangements that the EU has with its trading partners, bilateral preferential trade depends on the entire structure of applied tariff preferences and not only the direct bilateral preference.
For example, African sugar exporters to the EU enjoy preferential duty-free access to the EU market compared to the MFN applied tariff of €339/tonne. However, the value of this preference depends also on the number and significance of other exporters that may also have preferential access. If the EU-Mercosur free trade agreement is ratified, South American exporters will gain the right to export 180,000 tonnes of sugar duty-free to the EU market. Although only around 1% of EU sugar production it may still have a negative impact on African exporters even without any change to their specific preferential arrangement.
Thus, the preferential margin enjoyed by an exporter should not be measured relative to the MFN tariff but to a ‘reference tariff’ that is some weighted average of the tariffs faced by all competing exporters. But this gets us back to the issue identified above of how to solve the aggregation problem given that there are hundreds of bilateral duties.
Some clever Italian agricultural economists, Maria Cipollina and Luca Salvatici, have come up with a way to do this that is theoretically consistent and their paper has just been published in the European Review of Agricultural Economics (paywall). Their approach includes not only competing third country exporters to the EU market but also considers intra-EU trade.
One counter-intuitive implication of the insight that it is relative preferences that matter is that not all preference recipients enjoy preferential access to the EU market. If one country’s preference is relatively shallow and its competitors have deeper preferences, it could actually find itself worse off than if all preferences were removed. Despite its apparent preference relative to the MFN tariff, it actually has a negative preferential margin when compared to the ‘reference tariff’.
I present two tables from the Cipollina/Salvatici study that capture their main messages. The first table classifies the annual average EU agri-food imports over the period 2005-2017 into preferential imports (29-32% of the total) and MFN imports (70% of the total).
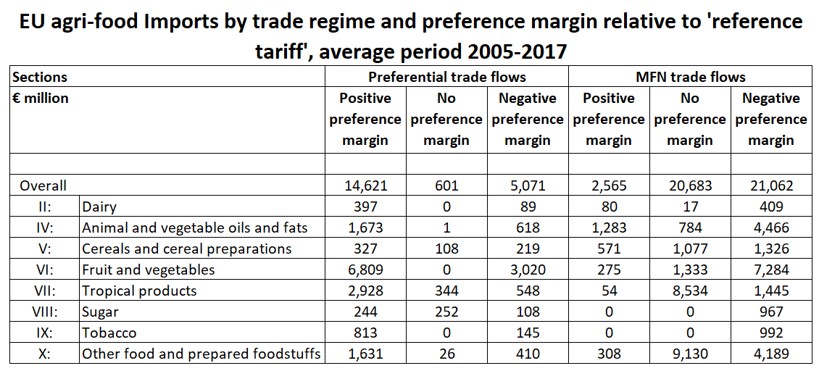
The left-hand side of the table further classifies preferential trade into whether imports enjoyed a positive preference margin, had no preference margin, or even had a negative preference margin relative to the ‘reference tariff’. While most imports facing preferential tariffs did enjoy a positive preference margin, around one-quarter of so-called preferential imports actually had a negative preference margin because they were competing with exporters that enjoyed even deeper preferences.
The right-hand side of the table shows the same classification for import flows entering under the MFN tariff regime. MFN exporters are at a disadvantage relative to preferential exporters and most MFN imports are shown with a negative preference margin. However, almost as great a volume of MFN imports suffer no disadvantage presumably because the MFN tariff and thus also the ‘reference tariff’ are both zero.
On the other hand, there are some MFN imports that even have a positive preference – the bilateral MFN tariff is lower than those faced by competitors. This occurs for imports facing specific tariffs which have to be converted into AVEs by dividing by a unit value. The authors explain this apparent anomaly by noting that this happens when particularly high bilateral unit values lower the value of the bilateral MFN AVE tariff. They point out how this means high-quality exports can enjoy preferential treatment even in the absence of an explicit preferential policy if they face specific tariffs.
The question the authors then ask is what would happen to these trade flows under two scenarios, both based on 2014-2017 import flows. The first is where all preferences are removed and tariffs are raised to the MFN level. This gives an estimate of the value of preferences in increasing agri-food imports. Like most previous studies, they conclude that the EU’s preferences are effective. They estimate that, on balance, EU preferences have increased imports by around €4.7 billion (around 7% of predicted trade) based only on the sectors for which they got statistically significant results.
The second scenario looks at the trade effects if all tariffs were removed and thus measures the trade effect of actual EU agricultural trade policies. Their results are shown in the next table. They conclude that the overall protectionist impact of EU trade policies in agriculture is quite large and amounts to €18.7 billion, 13% of predicted trade, based again on the sectors for which they got statistically significant results. Removing protection would lead to increased trade of €20.3 billion, but this would be offset by the disappearance of some existing import flows valued by €1.6 billion. They suggest this represents what developing countries would lose as a result of preference erosion.
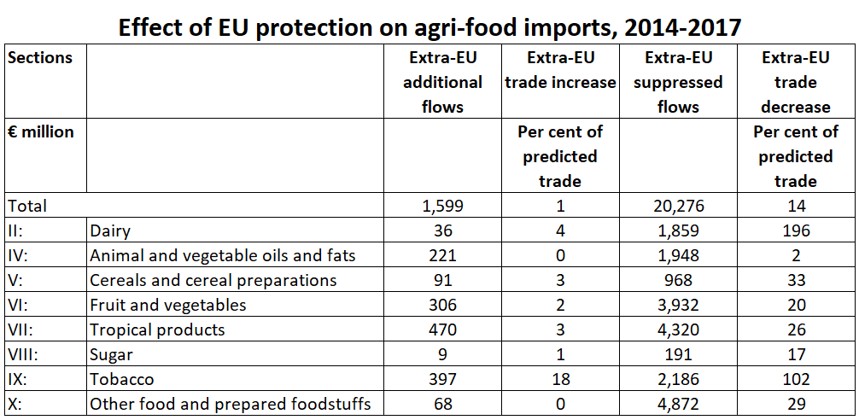
The distribution of this suppressed trade across sectors is interesting. Most trade is suppressed in processed food products, tropical products, fruit and vegetables, and tobacco. These are not the sectors that we normally associate with agricultural trade tensions which revolve more around beef, dairy products, poultry, sugar and rice. Animal products (and Beverages) are not included as the results were not found to be statistically significant, perhaps due to the role of factors such as sanitary and phytosanitary barriers (in the case of animal products) or excise duties (in the case of beverages) that influence imports and thus complicate the estimation.
Conclusions
In this post, I have reviewed the evidence on the continued significance of import protection for agri-food products in the EU. The focus has been on tariff protection. Non-tariff measures can also increase the cost of entering the EU market and provide an additional level of protection to EU producers.
Setting the level of agricultural tariff protection is no longer the responsibility of DG AGRI but is now part of decision-making on the EU’s Common External Tariff. As a result, the level of import protection receives little attention in debates on agricultural policy, although the heated debates on agricultural concessions when negotiating free trade agreements testifies to its continuing importance.
As noted in the 2019 WTO Trade Policy Review of the EU, agricultural tariffs stand out due to significantly higher rates, wide tariff range, use of non-ad valorem tariff rates, and use of tariff quotas. This complexity makes it difficult to derive summary measures of the protective effect of these tariffs. Economists continue to debate the best ways of aggregating thousands of tariff lines into a single overall measure. Calculating the uniform tariff that would result in the same volume of imports as the existing differentiated tariff schedule seems to provide a promising benchmark, but the results are still dependent on the underlying assumptions made about the responsiveness of import demand to changes in prices.
A feature of the EU tariff schedule is the significant use of trade preferences. The implication of trade preferences is that some exporters benefit from high levels of EU protection because of the competitive advantage they receive compared to exporters without preferential access. The evidence suggests that preferences are effective in increasing trade. One consequence of this is that reducing MFN tariffs leads to the erosion of these preferential advantages. This issue has been most highlighted by the African, Caribbean and Pacific group of countries in the past.
Recent discussion of preferences has emphasised the importance of evaluating the preferential margin enjoyed by preference recipients not against the MFN tariff but in the context of the entire tariff structure facing exporters to the EU market. Preferences can be eroded not only if the MFN tariff is reduced, but also if preferences are extended or increased to other exporters.
Recent empirical work suggests that, overall, EU agri-food tariffs result in the suppression of €20.3 billion of imports, or around 14% of predicted trade. If tariffs were reduced to zero, this would be partially offset by preference erosion of around €1.6 billion. Of interest is that most of the missing trade is in sectors that are not usually the focus of trade policy concerns, such as processed foods, tropical products, fruits and vegetables, and tobacco. The reasons for this deserve further analysis.
Swinbank (2018) has called the recent moves towards a more market-oriented EU agricultural policy ‘incomplete’ because high tariffs continue to protect some farming activities distorting resource use in the agricultural sector and complicating trade negotiations (there is ample evidence for the latter as concessions on specific agricultural commodities are often the ‘make-or-break’ element in FTA negotiations).
The EU was prepared to reduce its bound agricultural tariffs (which for the most part are also the levels that are applied in practice) as part of an overall deal to conclude the WTO Doha Round of multilateral trade negotiations in 2008. Following the failure of that attempt, negotiations on the market access pillar of the WTO Agreement on Agriculture have made no progress. For the forthcoming WTO Ministerial Conference in Kazakhstan in June 2020, discussions on agriculture are focused on domestic support though with little chance of a breakthrough (see this Feb 2020 update from the Chair of the agricultural negotiations in the WTO).
The EU is unlikely to make any unilateral reduction in its bound tariffs separately from any multilateral agreement within the WTO. Nonetheless, some action could be taken to simplify its schedule. A major step would be to convert its specific and compound tariffs into simple ad valorem percentage tariffs.
Interestingly, this is precisely what the UK government proposes in its UK Global Tariff which is out for consultation until 5 March 2020. Unlike the proposed temporary no-deal Brexit tariff schedule it proposed in March last year which suggested a radical liberalisation of the UK tariff structure, the Global Tariff proposal would build on the EU CET but make some specific modifications. These include taking steps towards agricultural tariffs that are applied as single percentages.
Such a change would make the EU tariff structure more transparent and announcing it could provide a boost to the prospect for movement in the agricultural negotiations in the run up to the next WTO Ministerial Conference in Kazakhstan in June 2020.
This post was written by Alan Matthews
