How heavily protected is EU agriculture by import tariffs? How does EU agricultural protection compare with other countries? To answer these apparently simple questions requires a huge amount of spadework, and we will see that there are different answers which can all lay claim to be ‘correct’. Fortunately, a joint team at the Centre d’Etudes Prospectives et d’ Informations Internationales (CEPII) in Paris and the International Trade Centre (ITC) in Geneva undertakes this necessary legwork and publishes their results every three years as the MAcMap-HS6 (Market Access Maps) global tariff database. MAcMap Version 3 covering tariff data for the year 2007 has just been published. It’s an impressive resource – the Version 2 database took up 8 GB of disk space! Hats off to the researchers involved, Houssein Guimbard, Sébastien Jean, Mondher Mimouni and Xavier Pichot.
A picture of global agricultural protection
A unique feature of MAcMap is to allow a meaningful average level of applied protection worldwide to be computed. The world-wide average tariff applied on agricultural products in 2007 was 15.9% (‘agriculture’ refers to products classified as agricultural by the WTO Agreement on Agriculture). Average tariffs varied (for the countries shown in the graph) from 1.5% for Australia to 60.5% for India. The EU’s average of 14.6% happens to equal the average agricultural tariff for developed countries as a whole. Agricultural tariffs are slightly higher in developing countries, although this is not the case for the least developed countries (countries are classified as developed or developing according to their status at the WTO).

A feature of MAcMap is that it can also calculate the average tariff faced by exporters, taking into account the commodity composition of their exports and preferential schemes from which they may benefit. Australia’s interest in agricultural trade liberalisation is underlined by the fact that, although it applies the lowest tariffs on agricultural imports (though accompanied by strict SPS standards which are also effective at limiting market access), it faces the highest tariffs on its exports for the countries shown in the graph. India is at the other extreme, with very high tariffs on agricultural imports but facing relatively low tariffs on its exports. The EFTA countries also stand out with high import tariffs on average. The EU actually faces higher tariffs on its agricultural exports than it applies on its agricultural imports.
Bound vs applied tariffs
Producing tariff averages of this kind is not straightforward, for a number of reasons. The first decision is whether the tariff average should reflect the bound (maximum) tariffs which appear in a country’s WTO schedule of commitments, or the applied tariffs actually used in practice. Some countries may opt to set their Most Favoured National (MFN) tariffs at rates below their bound tariffs (for example, the EU applies a zero tariff currently on imports of cereals because of the high price of cereals on world markets).
A more common reason for differences between bound and applied rates is the existence of preferential schemes, where a country applies a lower tariff on imports from partners in a free trade agreement or from developing countries. Applied tariffs obtained by weighting the MFN and preferential tariffs by the relative importance of MFN and preferential imports better represent the actual degree of protection enjoyed by domestic farmers.
Converting specific tariffs to ad valorem equivalents
Many agricultural tariffs are specific (that is, set as a fixed amount per tonne or per litre). To permit aggregation they must first be converted into their ad valorem equivalent (that is, expressed as a percentage tariff). To do this, the specific amount must be compared with the underlying value of the imported good.
The value of the imported good is usually calculated from the trade statistics as the unit value obtained by dividing the total value of imports in a particular tariff line by the volume. However, bilateral unit values tend to be very volatile and prone to reporting errors and can only be calculated if a trade flow has taken place. Also, a specific tariff encourages exporters to export higher-quality goods with higher unit values (because a specific tariff is less of an obstacle on a higher-valued good); this would lead to a downward bias if bilateral unit values are used to estimate the AVEs of countries which make more use of this form of tariff protection.
One option to avoid these problems is to use a global average unit value rather than a bilateral or country-specific unit value when converting specific tariffs to their AVEs. However, this misses another link between unit values and quality, namely, that exporting countries specialise in goods of different quality. Developing countries are usually assumed to export goods of lower quality, and thus with lower unit import values. If they are required to pay the same specific tariff as exporters of higher-quality goods, then they face higher AVEs. The MAcMap database uses unit values derived from reference groups made up of exporting countries with similar characteristics to take account of these relevant quality differences.
Treatment of tariff rate quotas
Another area of complexity in arriving at the percentage tariff arises where some imports in a particular tariff line enter under a Tariff Rate Quota (TRQ). A TRQ is distinguished by having two tariffs – an ‘inside’ tariff levied on imports up the ceiling specified in the TRQ, and an ‘outside’ tariff levied on imports beyond the ceiling. Which tariff is used when aggregating this tariff line into the average makes a big difference to the results. This is not a trivial issue in relation to agricultural tariffs. For example, according to the MAcMap database, over 9 per cent of the EU’s agricultural tariff lines were associated with TRQs in 2007, and imports under TRQs accounted for 18 per cent of EU agricultural imports.
The MAcMap procedure is to make use of information on the TRQ’s ‘fill rate’, that is, the relationship between actual imports and the ceiling. When actual imports are well below the ceiling, the ‘inside’ tariff is used, and when actual imports are close to or above the ceiling (apart from cases where the ‘inside’ tariff automatically applies without quantitative restriction), the ‘outside’ rate is used.
Aggregation schemes
Once individual tariffs have been expressed as percentages, they must be aggregated to the country average. Different aggregation methods give different results. The simplest method is to use a simple average, where each tariff line is weighted equally. This method takes no account of the value of trade associated with each tariff line, and is also influenced by the number of tariff lines associated with individual products. Often, for sensitive products with relatively high tariff rates a country will use a finer sub-division with more tariff lines, and this will tend to bias a simple average upwards.
An alternative is an import-weighted average, where the tariff associated with each tariff line is weighted by the value of imports. In principle, this gives more weight to those tariffs which are more important to a country’s trading partners. The measure suffers from a problem known as ‘endogeneity’, in that the higher the tariff, the more restrictive it becomes and the smaller the value of imports associated with it. In the limit, a prohibitively high tariff is associated with zero imports, and thus is excluded in an import-weighted average. Because of the importance of tariff peaks in agricultural tariffs, the import-weighted average will often lie below the simple average for this reason.
The MAcMap database uses an exporter reference group weighting scheme using the same reference groups as for the calculation of unit values. Bilateral applied tariffs are aggregated using weights derived from the exports of a given country toward a group of countries (the reference group) to which the import country belongs, rather than derived from bilateral trade. Since different countries pertaining to the same reference group share common demand features but are likely to have different trade policies, the endogeneity bias is reduced.
Comparison of weighting schemes
The MAcMap publication compares how the calculation of average agricultural tariffs is affected using different weighting schemes. In addition to the simple, import-weighted and MAcMap reference group weighted averages, it also includes averages calculated using the ITC methodology. The ITC aggregation scheme is also based on reference groups, with the same general principles as used in MAcMap, but using eleven reference groups rather than the five in MAcMap. Another important difference is that the ITC computes AVEs at the tariff line level based on bilateral tariff-line unit values (incidentally, this is also the approach agreed for use in the WTO when negotiating tariff reductions in the Doha Round) rather than the exporter reference group approach used in MAcMap.
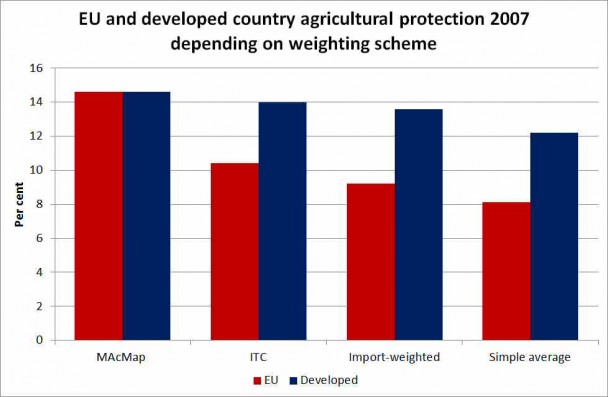
The theory outlined above would predict that the simple average increases the measure of protection, while the import-weighted average reduces it, with the reference group measure falling somewhere in between. When looking at the pattern of protection across all sectors using different weighting schemes, this ranking generally holds. However, this is not the case for agriculture for reasons that are not immediately clear. Here the simple average returns the lowest average figure. Indeed, the EU average rate of applied tariff protection in agriculture is just 8% using the simple average, compared to the 15% reported using the MAcMap reference group approach.

Using the MAcMap figures, the EU’s protection of its average agricultural sector is the same as for developed countries as a whole. However, using any of the other approaches shows that average agricultural protection in the EU in 2007 was considerably below the average for developed countries as a group.
The unsettling conclusion is that there is no ‘correct’ or unique answer to the question posed at the outset of this post as to what is the average level of EU agricultural protection and how it compares to other countries. This is not a criticism of MAcMap but inherent in the nature of the exercise. It is necessary to remember these caveats when comparisons of agricultural protection across countries are shown.
Photo credit Staxnet

Europe's common agricultural policy is broken – let's fix it!

