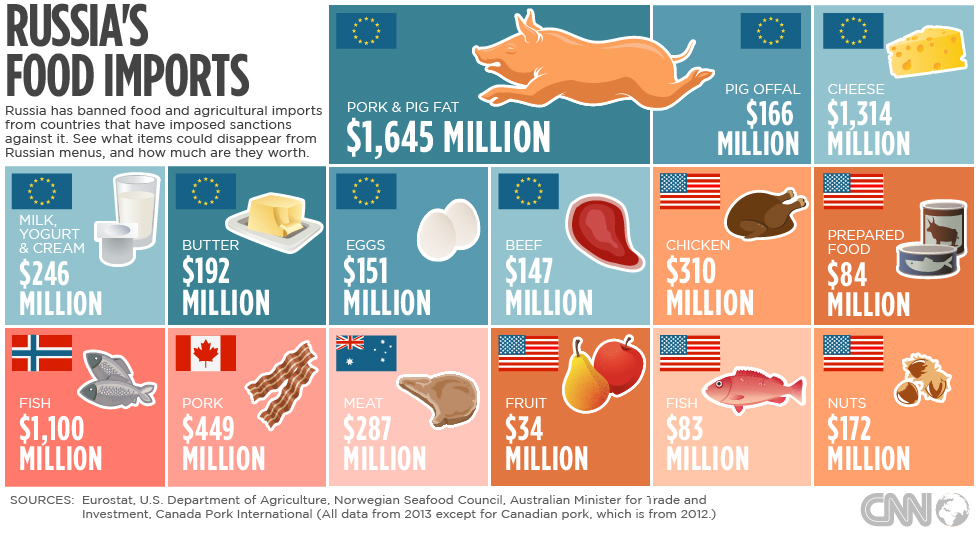
The 2013 CAP reform and biodiversity

A recent paper in Science (unfortunately, behind a paywall unless you have access through a library or individual subscription) written by 21 authors from across Europe provides a very timely review of the impact of the recent CAP reform from the perspective how it addresses the EU’s biodiversity commitments. UPDATE There is a short summary by one of the authors here.
The EU’s overall objective in its Biodiversity Strategy for 2020 agreed in 2011 is to halt the loss of diversity and to restore degraded ecosystems. Specifically, Target 3A is to “maximise areas […] covered by biodiversity-related measures under the CAP”. While this is not a very meaningful target, it was presumably intended to imply that the CAP should do much more in the future to prevent and reverse declines in biodiversity. The authors conclude that the CAP reform does not fulfil this target.
CAP greening and biodiversity

The authors review the three main greening measures under Pillar 1 as well as the prospects for financial support to enhance biodiversity measures under Pillar 2 and find them wanting.… Read the rest

What is happening to EU agricultural productivity growth?

Agricultural growth can come about through bringing new resources into production (new land, extension of irrigation, or input intensification per hectare) or through raising the productivity of existing resources. The appropriate measure of productivity growth in this context is Total Factor Productivity (TFP) growth, which is defined as the aggregate quantity of outputs produced by the agricultural sector divided by the aggregate quantity of inputs used to produce those outputs.

This measure contrasts with partial productivity measures such as growth in labour productivity or land productivity (yields per hectare) because an increase in these partial productivity measures can be achieved by increasing the intensity of use of other inputs (for example, crop yields can be increased by applying greater amounts of fertiliser or using more labour). Thus, partial productivity indicators do not measure ‘true’ productivity growth.

A higher level of TFP in agriculture can mean achieving greater output for the same inputs or using fewer inputs for the same level of output.… Read the rest

Overcoming the deadlock on cultivation of GM crops in EU countries

EU policy on genetically-modified organisms (GMOs) for use in food and agriculture has been deadlocked for a number of years as member states, industry stakeholders and non-governmental organisations remain conflicted about the use of agricultural biotechnology. Three examples of the policy differences and contradictions that characterise this dossier include the following.

  • The risk assessment procedures in the authorisation process are criticised by opponents of the use of GM plants, food and feed as too lax, but on the other hand as too long-drawn-out and unnecessarily complicated by the biotech industry.
  • Member states are so divided that there is neither a sufficient majority in the Council for or against a decision to approve GM events for cultivation or food and feed use, leaving the Commission by default to take the final decision. Most recently, at the General Affairs Council last February, 19 of 28 EU countries voted against granting approval for the cultivation of a GMO maize variety, Pioneer 1507, developed by DuPont and Dow Chemical.
  • Read the rest

    How to interpret cross-compliance

    Tomás García Azcárate, who maintains a very useful blog on the CAP with links to his university course notes and a series of CAP capsules, recently paid me the compliment of discussing a comment I made in an article on CAP greening on the function of cross-compliance. My comment was that “… the strong political support for the view that direct payments are, in part, recognition of the costs that the society asks farmers to bear through cross compliance implicitly undermines the “polluter pays principle. If farmers who do not receive direct payments are not expected to observe cross compliance standards, then these do not form the environmental baseline”.

    Tomás disagreed with this statement arguing that cross compliance does not oblige farmers to respect new rules. I put my hand up immediately to admit that the extract could have been clearer. It is well-known that cross compliance consists of respect for Statutory Management Requirements (SMRs) (provisions drawn from the application of relevant articles of legislation now listed in Annex II of the new horizontal Regulation (EU) No 1306/2013) as well as standards of good agricultural and environmental condition (GAEC) of land.… Read the rest

    Incentivising soil carbon sequestration

    Soil contains a huge amount of carbon, twice as much as in the atmosphere in the 0-30 cm layer alone. However, continuous cultivation over a long period has reduced stocks of soil organic carbon (SOC, which I will abbreviate here to soil carbon), often to dangerously low levels. The EU’s Joint Research Centre estimates that some 45% of the soils of Europe have a low or very low organic matter content (0-2% organic carbon). The main mechanism for soil carbon loss is associated with ploughing, due to increased decomposition of SOC due to soil aeration and soil aggregate destruction, increased aggregate turnover and a reduction in aggregate formation.
    Reversing this process to build up soil carbon stocks has thus the technical potential to sequester a lot of carbon. The practices to do this are now well known: they include the use of winter cover and catch crops; crop rotation; adding legumes or N-fixing crops; reduced or zero tillage; and incorporating crop residues and other organic matter.… Read the rest

    Competition issues in the single CMO regulation

    Recent volatility in food markets together with the perception that price changes are transmitted differently at different stages of the food chain have renewed focus on issues of market power and the limited bargaining strength of farmers compared to other actors in the food chain. European and national competition authorities have increasingly monitored the functioning of the food supply chain, enforcing competition rules where necessary.
    Strengthening the role of producers was one of the objectives of the recently-revised single Common Market Organisation Regulation (EU) No 1308/2013. Producer organisations, associations and interbranch organisation can now be recognised for all agricultural sectors and not just in fruit and vegetable production. Member states are authorised to introduce the compulsory use of written contracts with a number of standard clauses in their legal systems. These rules apply to all sectors except for milk and sugar where specific sectoral rules apply. The rules on contractual negotiations (collective bargaining) first suggested for the milk sector as part of the ‘Milk Package’ were extended to the beef, olive oil and table olives sectors as well as cereals and some other arable crops.… Read the rest

    Rising numbers of families cannot afford to spend enough on food

    The consequences of recent economic trends and the economic crisis for food consumption are graphically highlighted in a recent OECD report Society at a Glance 2014. The report discusses how many families have cut back on essential spending, including on food, compromising their current and future well-being. Reduced spending on food is one of the main causes of food insecurity, a term that describes a situation where inadequate access to food does not allow all members of a household to sustain a healthy lifestyle. According to the OECD:

    In the United States, where the incidence of food insecurity is monitored on a regular basis, rates of food insecurity have soared since 2007. While federal food assistance programmes in the United States now support roughly twice as many households as in 2007, the number with inadequate access to food at some time in the year has nonetheless climbed from 13 million (11% of all households) in 2007 to 17.6 million (15%) in 2012.

    Read the rest

    Comparative food prices across the EU

    The food system has been subject to a series of shocks, including the sharp rise in commodity prices since 2007 and the economic recession and subsequent austerity measures in many countries since 2009. These shocks are likely to have affected different countries in different ways, so what has been happening to relative food prices across countries as a result?
    Two sets of food price data are of use in this regard. Eurostat has developed a food prices monitoring tool which provides data on the monthly evolution of prices at different levels of the food value chain (commodity, processor and consumer) for EU countries. However, these data do not allow a comparison of the absolute level of food prices. For this, we need to look at Eurostat’s price level indices (PLIs) which are calculated as part of the Eurostat-OECD Purchasing Power Parities Programme.
    National prices are collected for around 500 comparable food and drink products.… Read the rest

    Global area under biotech crops continues to grow while EU policy struggles

    While the EU struggles to define its policy on the cultivation of GM crops, the area under GM varieties globally continues to grow. Recent data from the ISAAA show that the total global area planted to biotech crop varieties in 2013 reached 175 million hectares for the first time. As 1996 was the first year in which genetically-modified crops were commercialised on a significant scale (the first GM crop planted was tomatoes in 1994), supporters of the technology point out that this rate of expansion makes biotech crops the fastest adopted crop technology in recent history.
    Of the 27 countries which planted biotech crops in 2013, 19 were developing and 8 were industrialised countries. Latin American, Asian and African farmers collectively grew 94 million hectares or 54% of the global 175 million biotech hectares compared with industrialised countries at 81 million hectares or 46% of the total.

    Just four major GM crops dominate the market: soybean, cotton, maize and canola (rape).… Read the rest

    The distribution of CAP direct payments

    DG Agri recently published its latest report on the distribution of direct payments to farmers within the EU for the financial year 2012 (the payment year 2011). The payments covered are the Pillar 1 direct payments, but not payments under Pillar 2 or the national top-ups paid in the new member states.

    The report also provides comparative information with the financial year 2005 (payment year 2004) which is the first year in which farmers in the 10 new member states received direct payments; for Bulgaria and Romania, comparisons are made with the financial year 2008 (payment year 2007) which corresponds to the first year in which their farmers received payments following their accession.

    I reproduce here some of the graphs in the report which highlight its major conclusions. The report points out that looking at trends over time at the aggregate EU-25 or EU-27 level does not make sense, for two reasons.… Read the rest