

The extent to which agricultural growth can take place while at the same time reducing agricultural greenhouse gas (GHG) emissions is much debated. There is a widespread view, reflected in the agricultural mitigation chapter of the IPCC’s Fifth Assessment Report in 2014, that changes in food consumption patterns will be necessary if GHG emissions from global agricultural production are to fall sufficiently to help to stabilise the climate by 2050. The diet changes proposed, including a shift away from meat and dairy product consumption, would deliver emissions reductions by reducing agricultural production. Others point instead to the potential of technological advances to reconcile increased agricultural output with lower emissions, effectively allowing the decoupling of emissions growth from agricultural growth.
There are two kinds of decoupling. Relative decoupling means that the rate at which emissions increase is lower than the rate at which agricultural output increases. Another way of referring to this is as a reduction in the emissions intensity of agricultural production. And indeed there is a lot of evidence that the emissions intensity of individual agricultural products and of agricultural output as a whole has been steadily falling over time.
However, a fall in emissions intensity may not be sufficient to bring about absolute decoupling if, at the same time, agricultural output is increasing. Absolute decoupling means that, even though agricultural output may be increasing, absolute emissions are falling. Falling absolute emissions are necessary if agriculture is to contribute to slowing and eventually halting global warming.
In this post, I examine trends in EU agricultural output and agricultural emissions to assess the extent to which relative and absolute decoupling has occurred. The evidence suggests that the rate at which the emissions intensity of agricultural production is improving is slowing down, and that this has reversed the trend in the EU towards absolute decoupling in recent years.
Trends in EU agricultural output
Different indicators can be used to measure trends in the volume of EU agricultural output (for the purposes of analysing decoupling it is the volume and not the value of output that is relevant). At the macroeconomic level, decoupling is assessed by comparing emissions to the growth of GDP, where GDP can be defined as the aggregate value added in the economy. The analogous indicator for agriculture would be to compare agricultural emissions to agricultural value added (as measured by the Eurostat volume index for Gross Value Added (GVA) in agriculture at basic prices).
Agricultural value added nets out the use of animal feed and seeds whether grown domestically or imported as well as other intermediate inputs. While this makes sense when assessing the size of the economic contribution made by the factors of production employed in the agricultural sector, it may not be the right output indicator to compare with agricultural emissions.
Agricultural emissions in the national and EU inventories submitted to UNFCCCC are built up on an activity basis, that is, by applying emission factors to the hectares of different crops and numbers of head of different animals and poultry. Thus it may make more sense to compare agricultural emissions to agricultural goods output in the Eurostat Economic Accounts for Agriculture to capture the full production of crops and livestock within the EU (agricultural goods output is preferred to the more comprehensive agricultural output indicator which includes agricultural services again to be consistent with the emissions data later).
An intermediate indicator is produced by the FAO called the agricultural Gross Production Index. This is based on the aggregate volume of agricultural production in a country after deducting the quantities used for feed and seed. The intention is to avoid double-counting of feed and seed, once in the production data and once in the crops and livestock produced from them. The resulting aggregate represents disposable production for any use except as feed or seed. While as noted this may not be the best approach if the purpose is to calculate the emissions intensity of agricultural production, the indicator is useful as a measure of the amount of agricultural output available to the off-farm sector, either for direct consumption, further processing or export.
There is one other difference between the Eurostat and the FAO volume indices. In the case of the Eurostat indices, data in reference year prices are calculated using data in current (n) and previous year prices (n-1). The volume change in the reporting year (n) is obtained by dividing the volume of production in the reporting year measured at previous year prices by the volume of production in the previous year measured at previous year prices. The volume index is thus a Laspeyres chain index in which the base price weights change every year and in which the reference year (chosen in the graph below to be 2005) is set to 100. The GVA volume index is obtained by the method of ‘double deflation’, that is, the difference between output measured in the prices of the previous year and intermediate consumption measured in the prices of the previous year.
The FAO volume index is a Laspeyres index where the weights are fixed at 2004-2006 average international commodity prices expressed in so-called “international dollars”. The index shows the relative level of the aggregate volume of agricultural production for each year in comparison with the base period 2004-2006.
One final issue concerns data availability. The FAO Gross Production Index is available in the FAOSTAT database for the period 1990-2016. The Eurostat series for the EU28 cover the period 2005-2018. However, volume of production indices for the EU15 go back to 1993. These five indices are graphed in the first figure below.
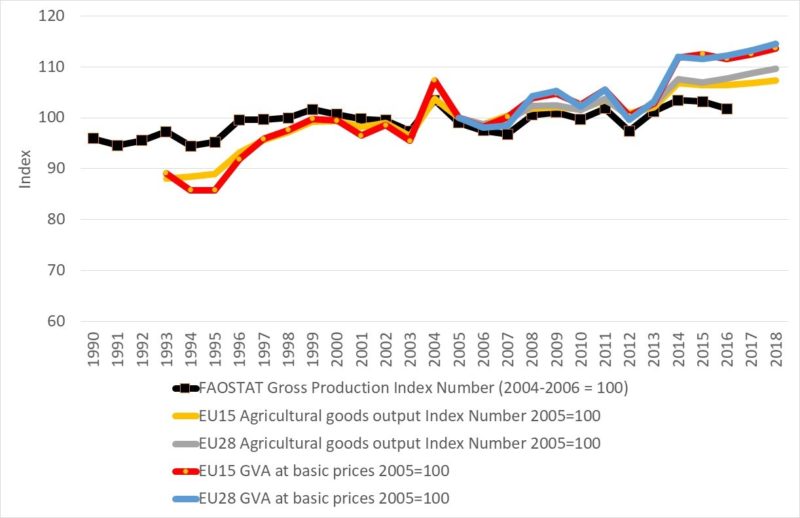
We can draw a number of conclusions from this graph:
- For most of the period there has been little difference between the trend in agricultural goods output and GVA volume (although the latter has been more volatile). However, a marked break occurred in 2014 with a much greater jump in the GVA volume index. This was due to the sharp increase in output in that year despite no increase in the use of intermediate inputs, which leveraged a proportionately greater increase in the volume of GVA.
- For the overlap period 2005-2018 there is little difference in the growth in output in either measure comparing the EU15 with the EU28 (apart from a little uptick in the EU28 index compared to the EU15 index for agricultural goods output in 2017 and 2018). This is not surprising given that production in the EU15 accounts for more than 80% of production in the EU28. We use this information to derive an EU15/EU28 indicator later in which the volume index for the EU15 for the years 1993-2005 is spliced and linked to the EU28 index for the years 2005-2018 (with 2005=100 for both series).
- The growth rate for EU28 agricultural goods output is 0.8% p.a. for the period 2005-2018 which was a fall from 1.2% p.a. for EU15 output in the period 1993-2005, resulting in a growth rate for the whole period of 0.7% p.a. (the counter-intuitive finding that the overall growth rate is less than the growth rates for the two half periods seems to be an artefact of fitting exponential curves to the data). The corresponding figures for the growth in the volume of GVA are 1.2%, 1.4% and 0.9%, respectively.
- The FAO series shows the lowest growth rate over the period, at 0.2% p.a. Whether this is because of differences in the scope of this index (the items covered), differences due to the price weighting methodology, or differences in the underlying commodity data, is not known. However, it should serve as a warning about the inherent uncertainty in estimating the growth rate of agricultural output.
Summarising, there has been positive growth in EU agricultural output over the past quarter-century, but growth has hardly been stellar. Based on Eurostat figures, agricultural goods output has grown by around 0.7% p.a. and GVA volume by around 0.9% p.a., due to a somewhat slower rate of growth in intermediate consumption. We now turn to ask what has happened to the growth in agricultural emissions and emissions intensity.
Changes in agricultural GHG emissions
The next graph provides the answer. Agricultural emissions (taken from the EEA GHG data viewer) refer to direct emissions from agricultural activity (not including land use) as reported to the UNFCCC as part of EU inventory reporting, aggregated to CO2 equivalents according to the weights in the IPCC’s Fourth Assessment Report. Agricultural output is the Eurostat agricultural goods output series for EU15/EU28 spliced in the way described above. Both series have been rebased to 1993=100 to make them comparable in the graph. The emissions intensity index is derived by calculating the ratio of emissions to output in each year.
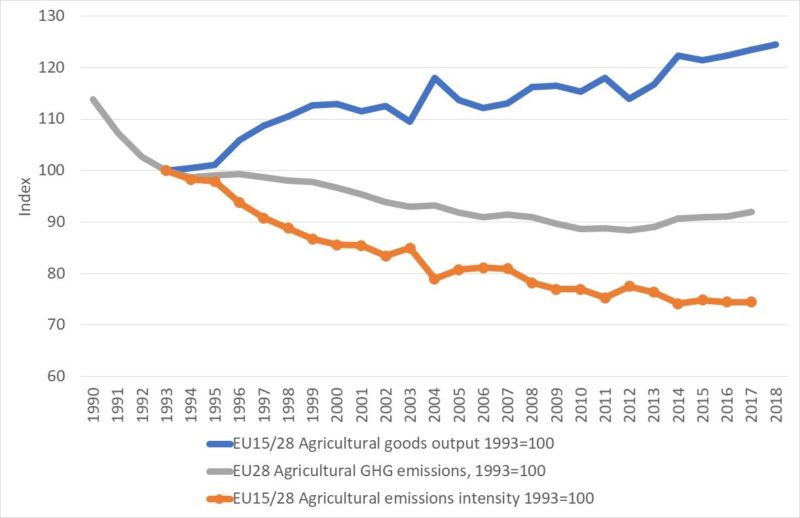
Agricultural emissions have declined since 1990 until 2012 since when they have grown slightly again. Half of the fall in emissions occurred in the three years between 1990 and 1993, years for which agricultural output data are not available. It may be that this reflects the upheaval in agricultural production in the central and eastern European countries from the transition from central planning to a market economy in 1990.
Because the agricultural output data only begin in 1993, this is also the start of the emissions intensity index. On average, the emissions intensity of agricultural production decreased by 1.2% p.a., or at a faster rate than the growth of agricultural production (0.7% p.a.) over the period 1993-2017. As a result, there has been both relative and absolute decoupling of emissions from growth over the period as a whole.
However, this positive story has been reversed since 2012. In the period 2012-2017 growth has taken place at the rate of 1.5% p.a., but the rate of decline in emissions intensity has been just 1.0% p.a. There is still relative decoupling, but no longer absolute decoupling.
While we can be sceptical that EU28 agricultural growth has reached a new norm in which growth will continue at 1.5% p.a. (the year 2012 was marked by a sharp fall in output and thus some of the recorded growth in 2012-2017 has been due to a recovery back to trend), what is more worrying is that visually there is a slowing down in the rate of reduction in the emissions intensity of production. The rate of reduction in emissions intensity was almost 2% (1.9%) p.a. in the first half of the period (1993-2005) and has now slowed to 1% p.a. in the period since 2012. If instead of using agricultural goods output we use the GVA volume index, the slow-down is less evident (from 2.1% p.a. in the period 1993-2005 to 1.8% p.a. in the period 2012-2017) but still exists.
This may reflect the slowing down of yield growth (for which there is evidence at least for crop production in some EU countries) which is one of the main ways in which emissions intensity per unit of output has been reduced. There may also be composition effects within agricultural output (shifts from less to more emissions intensive enterprises within the output mix). Exploring the reasons behind the slowdown in the improvement in emissions intensity of agricultural production would be a worthwhile exercise.
It would also be interesting to disaggregate this analysis by Member State, to see if there are some best practice countries which have managed to avoid this slow-down and from whom we could learn. Using the Kaya-Porter Identity for this purpose, by deconstructing emissions into their relevant elements, would facilitate policy-making for climate change mitigation. This is an issue the CAP post 2020 must urgently address.
This post was written by Alan Matthews
Picture credit: Wikipedia

I’m not sure how much it may be relevant, but I am increasingly concerned about the use of GDP in many of these assessments. This is because GDP includes the spending on public and private health services. So, if some foods are more likely than others to trigger ill health, they could be ranked as positive because of enhancing that part of the economy that is on public or private health treatment. Now, there is evidence that much lack of fitness and the increasing increase of diabetes type 2 is flowing from diets that are increasingly based around wheat, sugar and other high carb agricultural products – whether or not processed. Animal products from grass fed cattle, pigs etc do, by contrast, help to provide a better balance of omega 3/6 and other elements that support humans to be fitter and survive on less food volume, and less carbohydrates. Sorry: not the most coherent feedback, but I’m trying to get my mind around whether in fact a more animal based human diet might lead to lower public health costs, by comparison with a high carb vegetable based diet – lower value in GDP terms, but higher value in length of high quality life. If so, that would enable governments to invest taxes in more effective measures to lock up carbon – for example by tree planting of fields currently used for cereals.
You might be interested to see the trends in OECD countries, which we just declasssified: https://one.oecd.org/document/COM/TAD/CA/ENV/EPOC(2019)7/FINAL/en/pdf
In a snapshot:
-Trends in agricultural greenhouse gas emissions indicate a deterioration of agriculture’s performance in the OECD area. While GHG emissions were practically unchanged in the period 1993-2005, these emissions increased by 0.2% yearly in OECD countries from 2003 to 2015.
-Emissions from agricultural soils, mainly from the use of synthetic fertilisers, explain most of the rise of agricultural GHG emissions during the period 2003-15.
– GHG emissions per dollar of agricultural production (emissions intensities) kept declining in OECD countries in the period 2003-15, but at lower speed than they did in the period 1993-2005.
Thanks, @Guillaume, this is a very helpful reference.
@Richard
Thanks for your comment. You raise two separate issues.
On the technical issue of the use of the GDP indicator, the indicator has many well-known weaknesses, especially when used as a proxy for welfare and not just a measure of output. In the analysis in the post, I have used agricultural output as the benchmark to measure emissions intensity, so avoid most of the problems associated with use of GDP.
On the question whether a more animal-based human diet might lead to lower public (and private) health costs, the mainstream nutritional view is that we currently eat more meat than is good for us in developed economies. However, this mainstream view is challenged, largely on the grounds that the evidence is based on epidemiological associations and lacks clear causal associations. You might be interested in this review of the health-related impacts of meat consumption in media narratives as captured through the health section of the Daily Mail over the past fifteen years which points to the conflicting interests involved and the difficulties in separating out fact from fiction in this debate https://cris.vub.be/files/36633811/Leroy_et_al_2018_.pdf
Alan
I was fascinated by the analysis of Daily Mail articles, and the challenge of doing any research to medical science standards. What an interesting approach to research. Many of the reports don’t differentiate between the relative impact of processed versus unprocessed meat – not so much an issue for farmers’ decisions. It would be interesting to track similar coverage of the impact of sugar, refined carbohydrates etc. And again, of processed versus unprocessed foods. Professor Ray Goldberg at Harvard has led work on the “food system” – from farming to consumption, including access to food by the less well off. But the subsequent impact of personal consumption of food (as distinct from infected salad crops etc) on the cost of health systems (public or private) is difficult to quantify. Today’s UK headlines about the responsibility of individuals needing to take action to address diabetes type 2 is a small counter example.