
One of the demands in the ongoing farmer protests is for fair prices and a fair income. But how many farmers are there and what do individual farmers earn? In my previous post, I examined income trends at an aggregate level, both for the EU and for France as a Member State case study. In this post, I want to dig more behind the aggregate numbers to look at how incomes are distributed within the farming sector.
There are 9 million farms (holdings) in the EU. This figure comes from the latest Agricultural Census taken in 2020 (with figures in the inter-census years derived from the Farm Structure Surveys usually taken every three years or so). The requirements for a holding to be included in the Agricultural Census that year were set out in Regulation (EU) 2018/1091. Previously, there had been a specific requirement to cover all agricultural holdings above 1 ha in size. In the 2020 Census, this requirement was relaxed and the minimum size threshold for the utilised agricultural area was set to 5 ha. However, farms smaller than 5 ha had to be included if they exceeded other physical thresholds set out in the Regulation. Examples include 2 ha of arable land, 0.5 ha of vegetables or potatoes, 0.1 ha of vineyards, or 1.7 livestock units (I discuss the changing thresholds for inclusion in the Census and Farm Structure Surveys over time in this post on tracking structural change in EU agriculture).
The Census and Farm Structure Surveys measure agricultural activity on holdings – the area farmed, the area under crops and grassland, the number of livestock, the labour input. They do not attempt to measure the value of output. However, a notional value of output is calculated for each holding using the concept of Standard Output, abbreviated as SO. It is defined as the average monetary value of the agricultural output at farm-gate price, in euro per hectare or per head of livestock, in a given region. The SO is calculated by Member States for more than 90 separate crop and livestock items using basic data for a reference period of 5 successive years. SO values are regularly updated to reflect inflation. The 2020 Census used SO2017 reference data based on the 5-year period 2015-2019. The sum of all the SO per hectare of crop and per head of livestock in a farm is a measure of its overall economic size, expressed in euro. Eurostat has collected the SO coefficients used by Member States here.
Figure 1 shows the distribution of holdings, area, Standard Output and labour force across holdings of different economic size in the EU in 2020. These variables are distributed in a very skewed manner across the 9 million holdings. Fully 53% of these had a value of output (measured in economic size) of less than €4,000 even though they accounted for one-quarter (23%) of the agricultural labour force converted into full-time equivalents. Agricultural production on these holdings no doubt plays an important role in providing food for home consumption and as a complementary income source for these 2 million families. But these holdings contribute less than 2% of total EU output (measured as SO). Readers may disagree, but I would not consider these holdings as relevant to agricultural policy. Families producing less than €4,000 per annum in standard output are not expecting to be professional farmers.
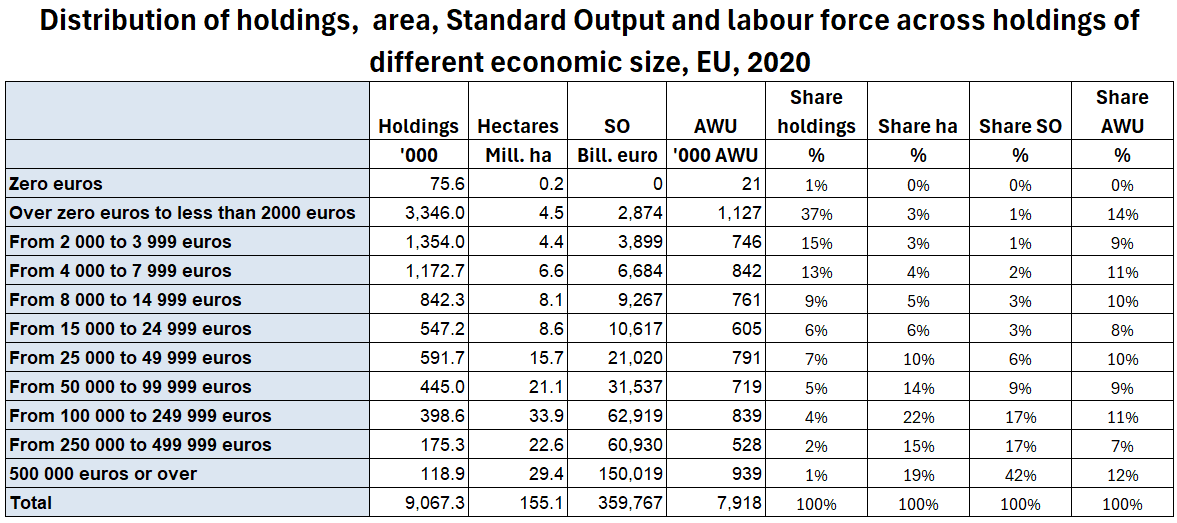
At the other end of the scale, just 295,000 holdings have a standard output over €250,000. They make up just over 3% of all holdings, they manage 35% of agricultural land, but they account for 59% of the standard output produced in the EU while accounting for just 19% of the agricultural workforce.
If we include the next two size categories, thus all holdings producing a standard output more than €50,000 per annum, they make up 13% of all holdings, manage 69% of agricultural land, account for 85% of standard output but provide employment to 38% of the agricultural workforce. It is this disparity in the shares of output and employment and its implications for agricultural incomes that we now focus on making use of data from the Farm Accountancy Data Network (FADN).
FADN as a source of farm data
FADN is an instrument to evaluate the income of agricultural holdings in the EU. Data are collected by Member States on an annual basis. The survey does not cover all holdings in the EU but only those that due to their size can be considered commercial. As explained by the Commission in the A to Z of FADN methodology (2020 edition) (requires EU login): “A commercial farm is defined as a farm which is large enough to provide a main activity for the farmer and a level of income sufficient to support his or her family. In practical terms, in order to be classified as commercial, a farm must exceed a minimum economic size. However, because of the different farm structures across the European Union, a different threshold is set for each Member State. Consequently, the set of farms which constitute the FADN field of observation in a given country is represented by those agricultural holdings surveyed by the FSS, with an economic size exceeding the threshold set for that country.”
The Commission states in that report that the annual FADN sample covers approximately 80.000 holdings, representing a population of about 5.000.000 farms in the EU, covering approximately 90% of the total utilised agricultural area (UAA) and accounting for about 90% of the total agricultural production. However, the sample size and the number of farms represented have been falling. In the following, I use the the public FADN database for 2022 which is based on a sample size between 50,000-60,000 holdings representing around 2,600,000 farms. These are the farms deemed commercial farms by each Member State. However, at the time of making the analysis data from only 21 Member States have been reported, so these data are incomplete. When the full data set becomes available, the absolute numbers in the tables below may change, but the conclusions drawn will remain the same.
Figure 2 shows the breakdown of the farms represented in the FADN 2022 database by type of farming. Arable farms are the largest group, followed by Mixed farms, Other grazing livestock, and Dairy farms. There are significant differences in the average economic size of the different farming systems (as measured by their standard output). Pig and poultry farms are the largest on average using this measure, followed by horticulture, dairy and vineyards.
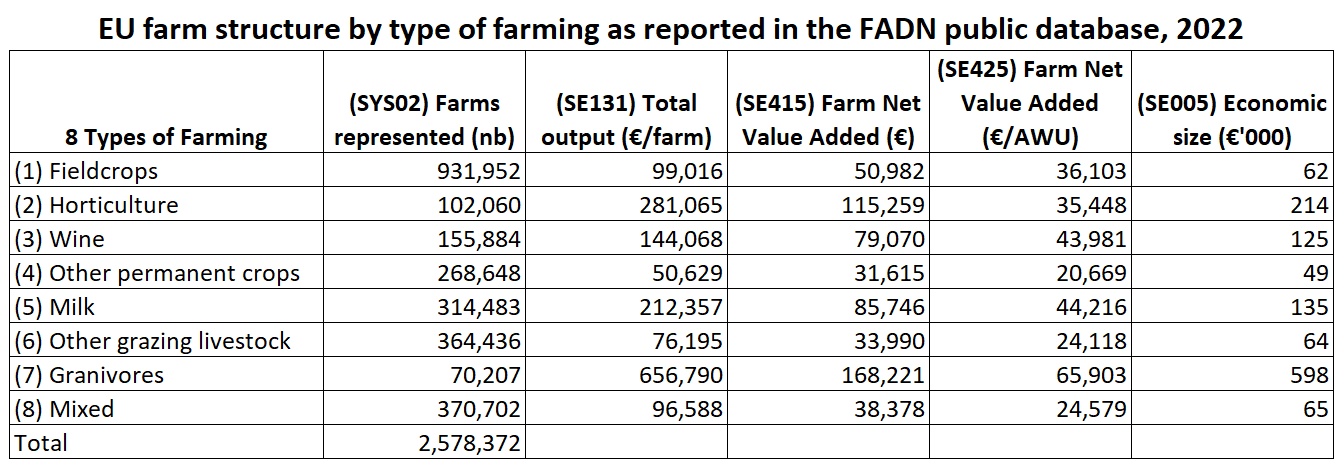
A feature of the 2022 data is that the average total output per holding for each type of farming system is generally higher than the calculated average economic size (with Other permanent crops the exception). Recall that the economic size is based on standard output coefficients calculated over the five-year period 2015-2019, whereas actual prices in 2022 were much higher than this average. Particularly dairy farms benefited from higher prices in that year.
We can also compare the Farm Net Value Added (FNVA) per Agricultural Work Unit (AWU) across types of farming, which is one of the possible measures of agricultural income (see the discussion in my previous post on agricultural income developments). Average agricultural incomes show significant variation across farming systems with pig and poultry farms clearly ahead. Also note the relatively low incomes on other permanent crop farms, cattle and sheep farms, and mixed farms.
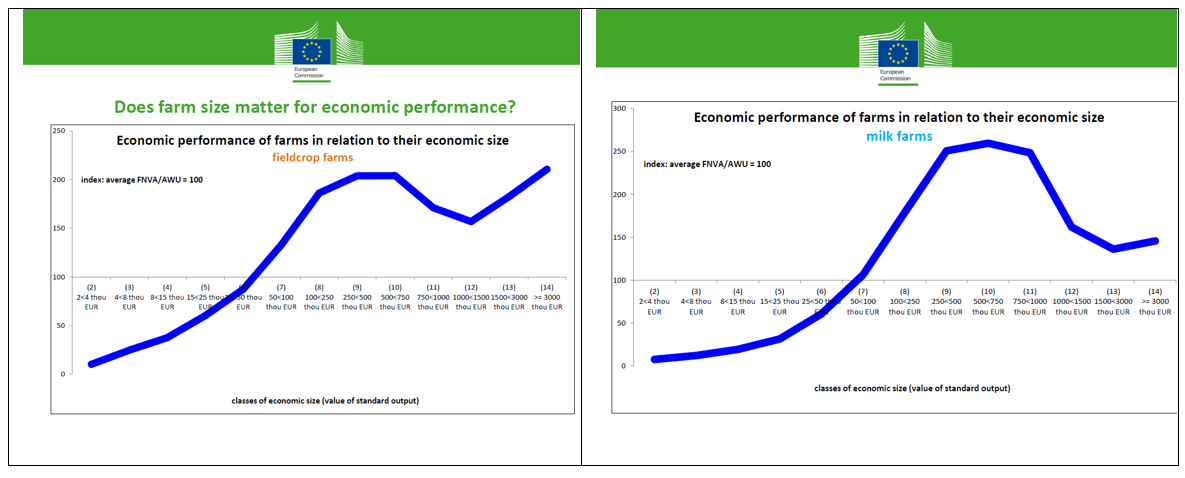
We are particularly interested in the relationship between economic size and agricultural income, as well as the shares of total output produced by farms in the different economic size classes. The FADN database has two economic size classifications, one with six size classes and the other with 14 size classes. Previous results (shown in Figure 3) using the 14 class classification show a distinct pattern with agricultural income (again measured as FNVA/AWU) increasing with economic size but then stabilising or even (in the case of milk production) showing a decrease with further increases in economic size (we will see later that this is associated with inefficiencies in the large corporate dairy farms using mainly paid labour in Central Europe that are important in these economic size classes).
It would be preferable to undertake the following exercise with the more disaggregated 14 size classes. Unfortunately, the public database does not make standard tables with 14 size classes by type of farming available. As a result, we provide an analysis based on the six economic size classes which unfortunately is much less definitive. Data from the FADN sample classified by economic size are shown in Figure 4.
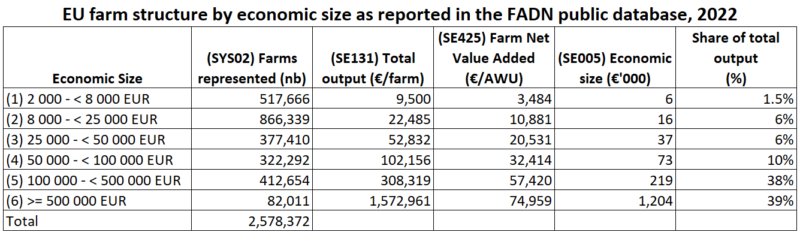
Again, we see the enormous disparities in the economic importance of different farms to total output. Farms with between €2,000 and €8,000 in standard output account for 20% of the farms represented by the FADN sample. The average agricultural income on these farms was €3,484 in 2022 and they made up less than 2% of total output.
At the other end of the scale, farms with more than €100,000 in standard output also made up 19% of the total holdings represented. But they accounted for 77% of total output and the average agricultural income per person on these farms was €60,328 (the weighted average of the figures €57,420 and €74,959 in Figure 3). Although this income must also remunerate interest on borrowed capital and rent on rented land, it still suggests a decent return to labour on those farms that produce more than three-quarters of EU agricultural output given that it is an EU-wide average figure.
Case study of the dairy farm system
We choose to examine the specialist dairy farm system for two reasons. It is a relatively homogeneous system, and we often hear the argument that dairy farmers are forced to sell milk below the cost of production. Despite being based on only six economic size classes, Figure 5 tells an interesting story.
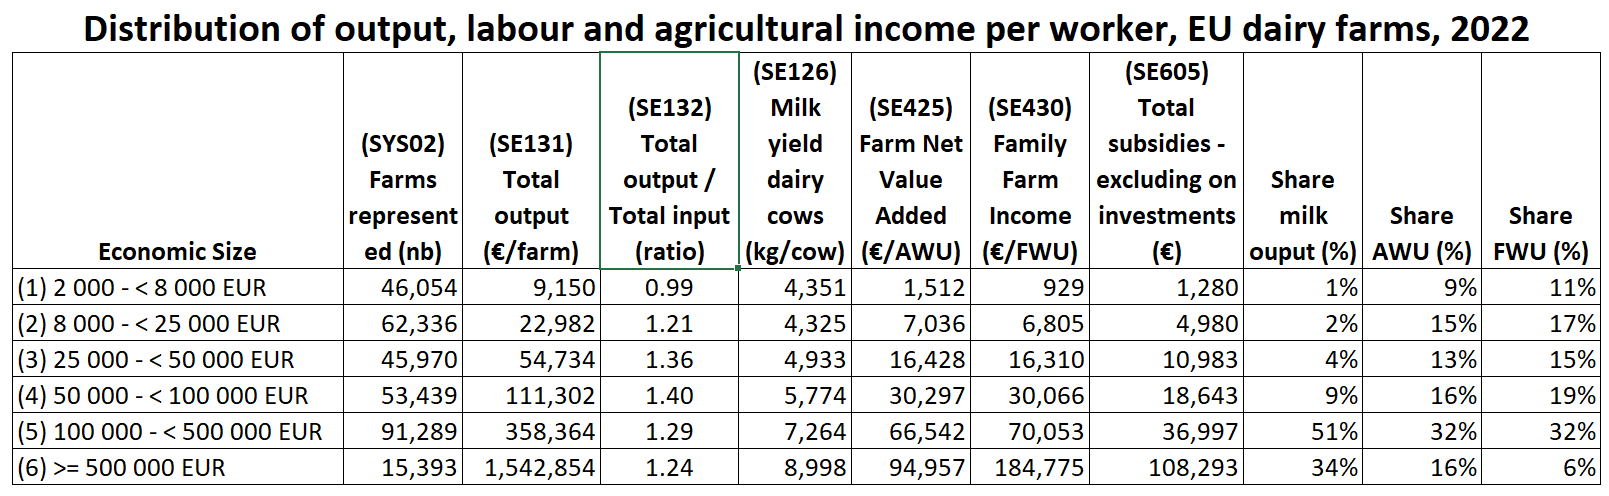
Notes: Shares of milk output in each economic size class are calculated by multiplying the number of farms represented in each size class (SYS02) by the number of cattle dairy cows in Livestock Units (SE086) and by milk yield per cow (SE126) to get the total volume of milk produced in each economic size class and then dividing by the sum of these volumes. Shares of labour are similarly calculated by multiplying the number of farms in each size class by the average AWU or FWU for farms in that size class to give the total work units in each economic size class and then dividing by the sum of these totals. These totals and shares only apply to milk produced on farms in specialist dairy systems as defined in the FADN database.
The first thing to note is that, as for all farms, there is huge variation in the total output of dairy farms in the EU. In 2022, this ranged from €9,150 on farms with between €2,000 and €8,000 standard output to over €1,500,000 in farms with a standard output above €500,000. Larger cow herds are one explanation (average herd size is 3 dairy cows in livestock units (LUs) for the smallest economic size group and 227 cows on average in the largest economic size group), but also there is a clear tendency for milk yields to increase as the economic size increases. This can reflect higher levels of concentrate feed but also higher levels of management, given that the majority of the very small herds are in Central and Eastern Europe.
Second, the ratio of total output over total input exceeds unity for all economic size classes except the very smallest. Total output is measured at producer prices (excluding all subsidies) while total input includes specific costs, overhead costs, depreciation and external costs but not the remuneration of family-owned labour and capital assets. We should remember that 2022 was a very favourable year for dairy farmers so these data may present an overly optimistic picture compared to an average trend. However, our interest here is not so much the absolute values of the different variables but rather how they vary across the economic size classes.
Agricultural income is shown according to both definitions, one being farm net value added (including subsidies) per total labour input (measured as AWU), and the other being family farm income (FFI) per unpaid labour unit (measured as Family Work Units (FWU). There is a clear relationship between agricultural income and the economic size of dairy farms, with the two largest size classes in particular appearing to secure an attractive income.
The important message is in the last three columns. Keeping in mind the rather crude basis for these calculations, we find that 85% of EU milk output on these commercial farms in the FADN sample is produced on dairy farms where there is an attractive income, but these farms only support 38% of the family farm workers on dairy farms though around 48% of the total workforce. This shows the greater importance of hired labour on the larger farms.
Put another way, around 62% of dairy farmers are managing farms where the return to their work effort is not adequate, even if they only account for 15% of total milk output. Almost two-third of dairy farmers will feel that their effort is not adequately remunerated.
I have included one final column in Figure 4 which shows another source of vulnerability, namely, the high dependence on direct payments under the CAP. The total subsidies figure includes coupled payments, direct payments, and rural development payments and has been normalised to account for the family labour force on the farms in each economic size group. CAP subsidy payments are important in all size groups, but are relatively more important, the smaller the size group. For the very smallest size group, CAP subsidy payments are effectively the family farm income.
Member State findings
As I commented in my previous post, EU-wide comparisons can be misleading because there is a clear preponderance of smaller farms in particular countries. As a result, EU-wide results examining the impact of economic size on agricultural income may confound the effect of economic size with country-specific impacts. We therefore complement the previous analysis by asking whether similar trends can be observed at the Member State level. Here we run into a problem with the FADN public database given that the range of variation within a Member State is much smaller than it is between Member States. With just six economic size groups, the dairy farms in many Member States only fall into two or three of these size groups, which does not allow for the type of analysis we have conducted for the EU. To obtain more relevant findings, the FADN classification with 14 economic size classes would be necessary. Nonetheless, some findings can be drawn from the data that are available.
The available data are shown in Figure 6 below. This large table shows a series of selected indicators for specialist dairy farms in the available size classes in most Member States – Germany is a significant absentee where FADN data for 2022 are not yet available.
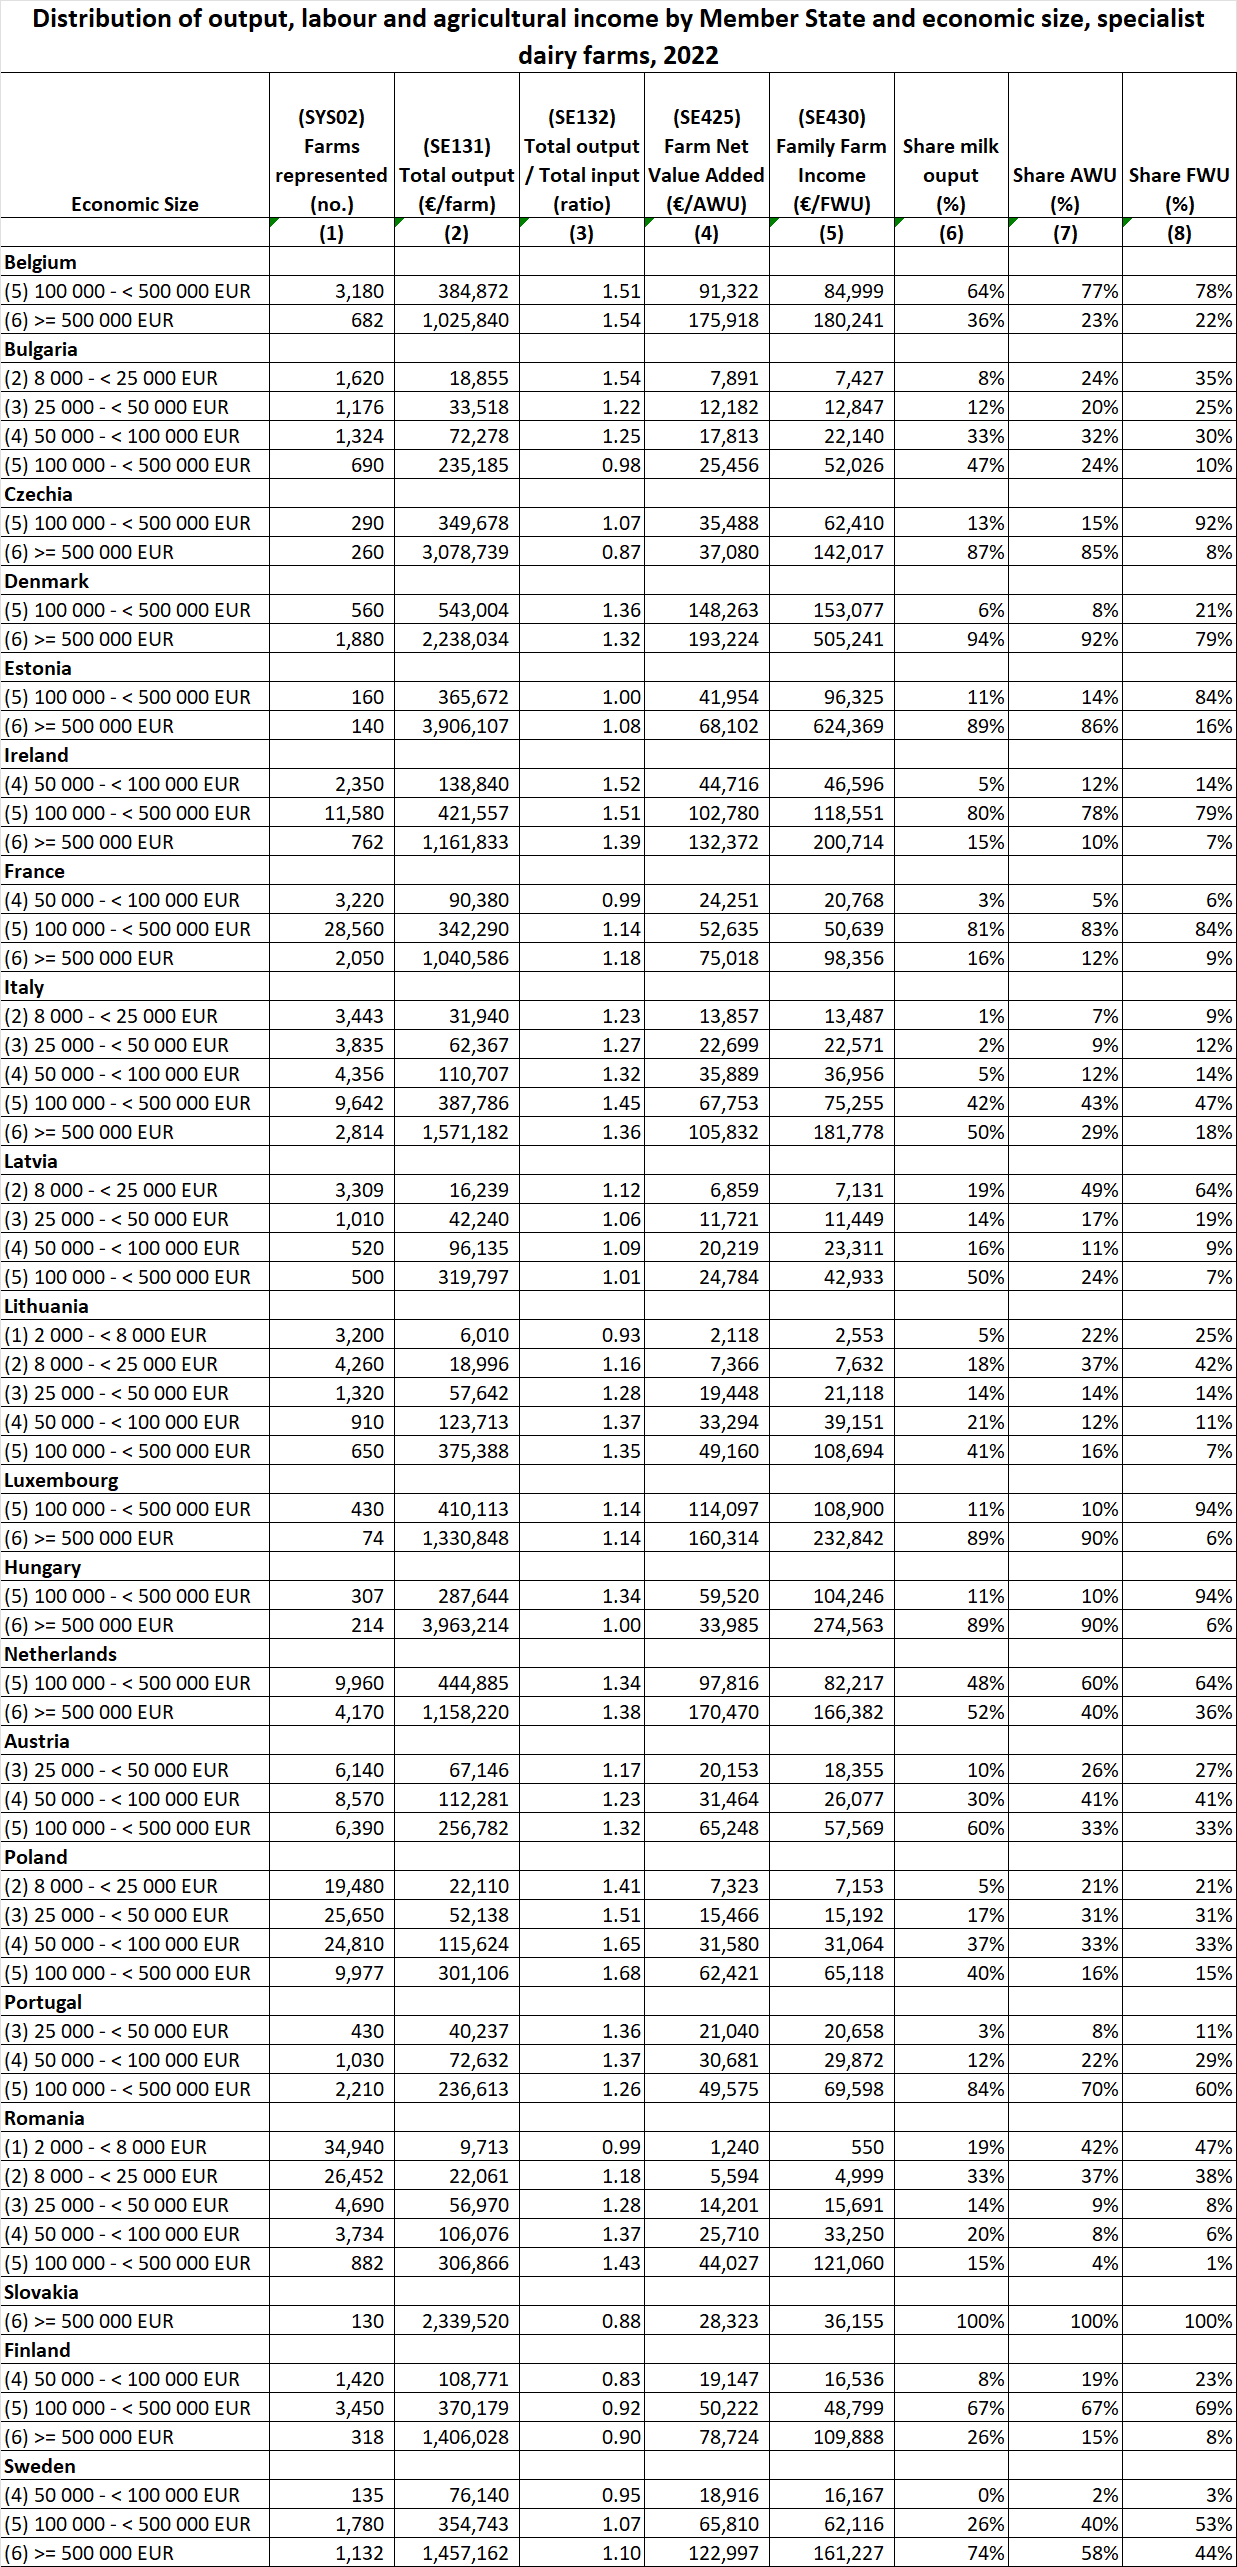
The first column in Figure 6 shows the number of specialist dairy farms represented in the FADN database in each country. In absolute numbers, most dairy farms are located in Poland and Romania, but many of these are very small farms with an economic size less than €25,000. On the other hand, most milk is produced on farms with an economic size greater than €500,000 in Czechia, Denmark, Estonia, Italy, Luxembourg, Hungary, Netherlands, Slovakia, and Sweden.
We are interested in the relationship between economic size and agricultural income, and also in how much of the total milk is produced on those farms where agricultural income can be considered reasonable. What is considered a reasonable income for dairy farmers will differ across countries given the wide disparity of wage levels within the EU.
Invariably, agricultural incomes per person (whichever definition of agricultural income is used) increase with the economic size of farm (the one exception is Hungary, where most milk is produced on farms in the largest size group but where profitability is lower for this size group than for the smaller size group in that country. This is also reflected in the ratio of total output to total input in that size group).
The ratio of total output to total input is an indicator whether a dairy farm is covering its non-labour costs or not. If we arbitrarily define a total output to total input ratio of 1.2 as ‘comfortable’ (given that 2022 was a record year for dairy prices), some countries stand out where milk producers may be in difficulty. These include Czechia, Estonia, France, Latvia, Luxembourg, Slovakia, Finland and Sweden, as well as the very largest farms in Bulgaria and Hungary. In some of these countries, dairying is in the hands of large-scale corporate structures that do not achieve the anticipated benefits of scale economies.
The cases of France, Sweden and Finland are of particular interest. To try to control for differences in farm structures in these countries, we examine the agricultural income of dairy farmers (measured as farm net value added FNVA/AWU) for the same size class €100,000 = < €500,000. For France, the figure is €52,635, for Finland it is €50,222, and for Sweden it is €65, 810. These values are low in comparison to countries that we might take as relevant comparators. For example, dairy farms in the same size class in Belgium earn €91,322, in Denmark €148, 263, in Ireland €102,780, and in the Netherlands €97,816.
One reason for these differences may be that the former group of countries are at the lower end of the size class range and the latter group of countries at the higher end of the size class range. This is partly borne out by the average number of dairy cows (in LUs) in this size class in each country in 2022: Belgium (74), Denmark (68), Ireland (100), France (72), Netherlands (76), Finland (50), Sweden (50). Ireland’s high FNVA/AWU is partly explained by its larger herd size, while the figures for Sweden and Finland are correspondingly associated with lower herd sizes. But France has roughly the same average herd size in this economic size class as the Netherlands (with double the FNVA/AWU) and as Denmark (with almost triple the FNVA/AWU). These figures seem to show French dairying in a poor competitive light.
Our main interest, to identify the agricultural incomes on those farms producing the bulk of the milk produced in each country, is complicated given that most countries only have farms in two or three of the six economic size classes available in the public FADN database. We leave to one side those countries where most milk is produced on large-scale corporate farms (easily identified by comparing the share of AWU and FWU in the different economic size classes).
Take the Netherlands, for example. 36% of the FWU work on farms that produced 52% of the milk and generated a FFI/FWU of €166,382 in 2022, while 64% of FWU work on farms producing 48% of the milk and where FFI/FWU was just €82,217 in 2022.
In Poland, 48% of the family labour force in dairying work on farms that accounted for 77% of milk output and earned incomes between €31,064 and €65,118 in 2022, while the remaining 52% of the family labour force in dairying work on farms that accounted for 33% of milk output but had an agricultural income between €7,153 and €15,192.
In Sweden, 44% of the family labour force on dairy farms work on farms that delivered 77% of the milk output of specialist dairy farms and earned €161,227 in 2022, but the remaining 56% of the family labour force worked on farms that delivered just 33% of the milk and earned between €16,167 and €62,116 in 2022.
Greater disaggregation of the economic size classes would be necessary to allow me to claim with confidence that the great bulk of the milk output in the EU is produced on farms with decent incomes. But the evidence from the Netherlands, Poland and Sweden suggests that this is indeed the case. Put another way, those farms with sufficient economic size to provide a decent income produce the bulk of our milk but provide that income to usually a minority of the family farm labour force in dairying.
Conclusions
The provocative heading of this post is ‘Who feeds Europe, and how much do they earn’. When looking at incomes, the economic size of farms cannot be ignored, with larger farms producing the bulk of our food generally able to generate much higher incomes than smaller ones (the relationship is complicated by the very large farms in Central Europe organised on corporate lines using mainly paid labour whose economic performance appears to be much patchier). While economic size is the main driver of income differences, others factors such as the type of farming system and conditions in individual Member States also play a role. This has obvious implications when we ask the question how to secure decent incomes in farming.
The key message of this post is that farms in the EU are very heterogeneous. This greatly complicates trying to answer the question that Commission President von der Leyen asked in launching the Strategic Dialogue at the EU Agri-Food Days in December. The Commission President posed four questions for the Strategic Dialogue, of which the first was “How can we give our farmers, and the rural communities they live in, a better perspective, including a fair standard of living?”. What I have demonstrated in this post is that a significant minority of farmers, significant in the sense that they are producing the great bulk of our food, already have the scale to achieve a fair standard of living. This leaves the majority of holdings unable to provide a decent income for those managing these farms.
The question for the Strategic Dialogue is whether policy should address the income problems on these farms and, if so, how. Under the usual market conditions, we would see this income problem addressed through the exit of smaller farms and farm consolidation. As I showed in my previous post, this has been the consistent pattern of structural change in EU agriculture, and it is one that I expect to continue (see also this earlier post).
There is an important debate to be had over the nature of this consolidation process. Many fear the emergence of corporate-style farms presumed to be associated with more industrial production methods. To the extent that this is the case, stricter environmental regulation as well as larger payments for ecosystem services would help to skew the playing field more in favour of those farms managing their land and animals in a more sustainable way.
Many of the measures put forward that are intended to help those farms without the scale to earn a decent income are unlikely to be effective because they fail to recognise the heterogeneity of farmers. Supermarkets are usually blamed for squeezing producer prices, and there are many proposals that, in one way or another, would require supermarkets to pay higher prices. But higher prices will be worth much more to those farms in the economic size classes above €250,000 that produce most of our food compared to those farms in those economic size classes below €25,000 which account for over half (52%) of the agricultural labour force (see Figure 1). Similar arguments can be made in connection with other proposals to raise farm prices such as restricting imports.
When we take account of the heterogeneity of farms, higher prices provide additional rents to those farms that already provide a decent income, while having a limited impact on those farms whose economic size is low.
This post was written by Alan Matthews.
Update 25 April 2024. It has been pointed out to me that the FADN 2022 database is incomplete at the time of writing as data is missing for 6 Member States. I have amended the post to highlight this fact. Thanks for the person who drew my attention to this!
Photo credit: Rural Ties – Tales of a Country Girl.
