

In my previous post, I calculated the size of the amounts that could be allocated to the degressive area-based income support payment using the minimum and maximum amounts of aid per hectare proposed in the NRPF Regulation of 130 EUR and 240 EUR, respectively. This payment is intended to provide area-based income support for eligible hectares to farmers to address income needs. The purpose of the exercise was to examine the potential allocations to other CAP instruments, for example, agri-environment-climate actions, depending on how much Member States allocated to the degressive area-based payment.
The limitation of that calculation is that it assumed that all hectares would receive these amounts, and thus it took no account of the potential impact of degressivity and capping. In this post, I try to provide a crude estimate of the likely impact of degressivity and capping for several Member States. It turns out that the degressivity and capping rules, though they seem sharp, will have a limited impact in practice in many countries.
In this post, I am only concerned with identifying the potential impact of the degressivity and capping rules. I do not discuss the policy intent of the proposal, whether this kind of targeting makes sense, or whether it is well designed for its purpose.
Degressivity and capping rules
The rules proposed for degressivity and capping are set out in the draft CAP Regulation Article 6 (3) and 6(4).
3. The total amount of payments per farmer established in accordance with paragraph 2 shall be degressive in accordance with the following rules:
(a) Member States shall reduce the annual amount of the area-based income support exceeding EUR 20 000 to be granted to a farmer by 25 % where the amount of the area-based income support granted to a farmer is between EUR 20 000 and EUR 50 000;
(b) Member States shall reduce the annual amount of the area-based income support exceeding EUR 50 000 to be granted to a farmer by 50 % where the amount of the area-based income support granted to a farmer is more than EUR 50 000 and not more than EUR 75 000;
(c) Member States shall reduce the annual amount of the area-based income support exceeding EUR 75 000 to be granted to a farmer by 75 % where the amount of the area-based income support granted to a farmer exceeds EUR 75 000.
4. The total amount of area-based income support shall not be higher than maximum EUR 100 000 per farmer per year. In the case of a legal person or groups of legal persons, the capping shall cover all holdings under the control of one legal or natural person.
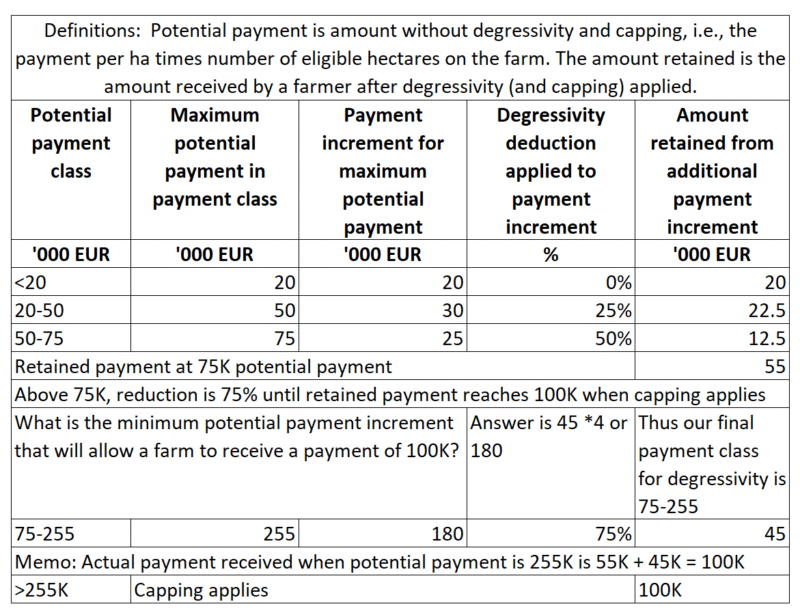
In a previous version of this post, I interpreted these paragraphs to imply a tiered system of deductions. A kind reader pointed out this was not fully correct, in particular I misinterpreted the way the highest degressivity rate and capping would be applied. In this revised version of the post, I have applied the following rules as set out in Table 1.
We should also recall that Member States can differentiate this payment by groups of farmers or geographical areas. Such differentiation would impact on the distribution of payments between farmers and thus on how degressivity and capping would work. As we cannot take account of differentiation we assume each hectare receives the same uniform payment.
Methodology
But this is only the first of many assumptions that are needed to devise a workable model. As the payments are linked to area, ideally we would like to have the distribution of all holdings in a country by their eligible area. We could then apply the assumed payment per hectare to derive the total payment per farm. We would then apply the degressivity and capping formula described in the previous section. Only Member State administrations and possibly the Commission have these data, so for the outside observer we have to make do with the information in the public domain.
The most relevant information is the distribution of CAP beneficiaries by payment size class published annually by DG AGRI. In a previous post I described some data from the latest report for the 2023 financial year which relates to payments farmers received in 2022. This was the final year of payments under the previous CAP Regulation before the current CAP entered into force.
The report provides tables showing payments for all direct payments, decoupled direct payments and coupled direct payments. For area-based payments the information on the distribution of decoupled payments is what we need. In 2022, this included the basic payment scheme, the single area payment scheme, the greening payment, the voluntary redistributive payment, the young farmer payment, payment for areas with natural constraints (which could be financed by Pillar 1 as well as Pillar 2 in that CAP), and the small farmers’ scheme. The eco-scheme had not yet been introduced.
The payment data are grouped into payment classes. We assume that all holdings within a payment class receive the average payment in that class. This assumption will influence the impact of the degressivity formula and implies that our results will be conservative and underestimate somewhat the impact of the formula (see technical note at the end of this post).
Applying the payment amounts per hectare for the degressive area-based payment results in total potential amounts for area-based income support that are different to the 2022 amounts paid in each Member State in 2022. I therefore scale the average payment in each size class to reflect the difference between the projected payment after 2027 and the actual payment in 2022. The assumption here is that the distribution of area-based payments after 2027 will be similar to that observed in 2022.
I then apply the degressivity and capping thresholds to these new projected average payments in each payment size class to derive the potential ‘savings’ that can be reallocated to financing other CAP instruments.
Exploration of results
Table 2 shows the results of this exercise for Spain. Spain has an average decoupled payment per beneficiary close to the EU average (which was €6994 in 2022) and also its degree of concentration of payments is close to the average – the top 20% of beneficiaries receive 78% of total direct payments support. The potential savings from applying the proposed degressivity and capping rules are estimated at between 6% and 14% depending on the overall allocation to the degressive payment. The savings are higher when the average payments per beneficiary are higher, as this means that more beneficiaries are pushed into the higher payment classes where the degressivity bites more. Nonetheless, what the exercise underlines is that the amounts involved are not enormous. Degressivity and capping will not cut the area-based payments in Spain in half, for example, freeing up this money to be spent on other CAP instruments.
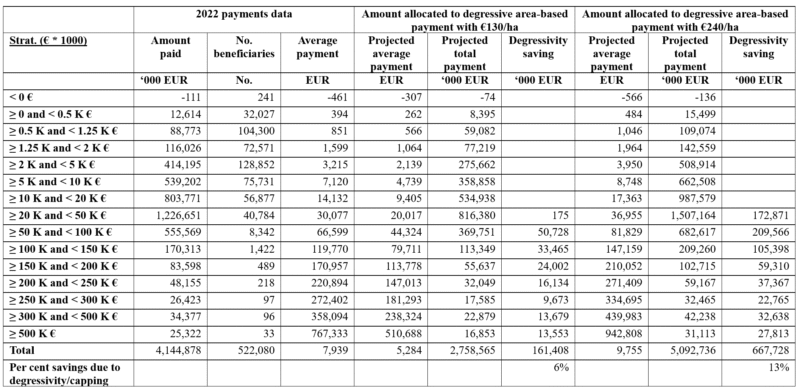
How the table is constructed: The 2022 payments data are taken from Commission, Indicative figures on the distribution of aid by size class, financial year 2023. The distribution of average payments and total payments by payment size class under the projected allocations for the degressive area-based income support under the minimum and maximum payment rates per hectare are obtained by scaling the 2022 figures in relation to the total projected allocations for the degressive payment. These total allocations are taken from Table 1 in the blog post https://capreform.eu/commission-proposal-could-allow-significant-increase-in-cap-basic-payments-in-many-countries/. The degressivity saving in each size group is calculated according to the rules set out in Table 1 in this post.
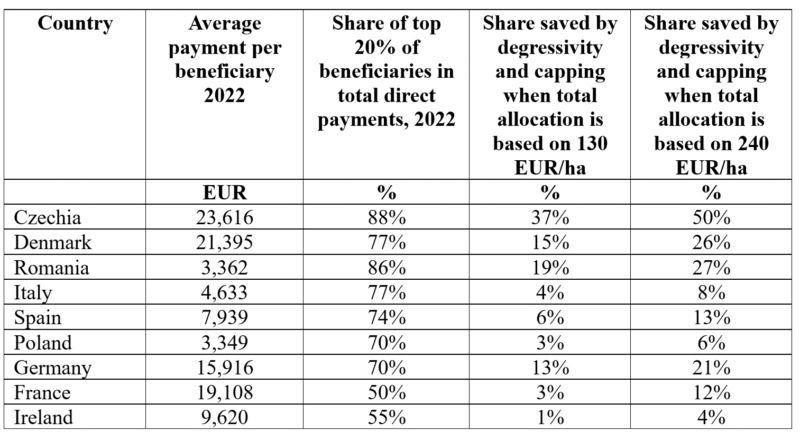
To check whether Spain might be a kind of outlier, I applied the same methodology to a selected group of EU Member States (there is no difficulty to add the remaining Member States and I provide the template for the workbook in a link in the technical note annex). The countries are chosen to reflect differences in the average payment per beneficiary and the degree of concentration of payments in 2022, as these are the two parameters which have the most influence on the percentage savings likely to be realised by degressivity and capping. Table 3 shows the results, where the countries are ranked by the degree of concentration in total direct payments.
The results show that Spain indeed sits comfortably in the middle of the table. Czechia is a country with both a high average payment and a very high payment concentration rate. Degressivity and capping would have a uniquely large impact in this country, potentially reducing area-based payments by between 37 and 50% which could then be allocated to other CAP instruments (any money saved by degressivity and capping remains ring-fenced for other types of CAP income support). Denmark has a similarly high average payment per beneficiary but payments are less concentrated. As a result, the potential savings brought about by degressivity and capping drop to between 15 and 26% which can be allocated to other CAP instruments. Romania, on the other hand, has a concentration ratio very close to Czechia but a much lower average payment, and the shares saved by degressivity and capping are very close to Denmark.
The role played by the average payment per beneficiary and the degree of concentration emerges clearly when we compare the four countries Italy, Spain, Poland and Germany. Italy and Spain have similar concentration rates but the average payment is higher in Spain. So while Spain could save between 6 and 13% through degressivity and capping, these shares drop to between 4 and 8% in Italy.
The comparison between Poland and Germany is even more clear-cut. Both have the same rate of payment concentration but average payments are almost five times higher in Germany than in Poland. The consequence is that degressivity and capping would result in savings of between 13 and 21% in Germany, which is closer to Denmark in this respect, while in Poland the savings would be much smaller at between 3 and 6%.
Finally, we compare the results for France and Ireland. France has the least concentrated distribution of total direct payments in the EU (apart from Luxembourg) but a much higher average payment per beneficiary compared to Ireland. This means that degressivity and capping could result in savings of between 3 and 12% in France, but only between 1 and 4% in Ireland.
Conclusions
In this post, I have used the available public information on the distribution of area-based payments to estimate the potential impact of degressivity and capping on the funds that might be allocated to area-based payments for income support in the proposed CAP. The interest in this question is because, assuming a fixed CAP budget at the minimum ring-fenced amount of €296 billion, the more funds that are allocated to area-based payments, the less are available for other CAP instruments such as agri-environment-climate actions.
Two scenarios are examined, based on the minimum and maximum amounts for area-based payments per hectare in the NPRF Regulation. By linking these payments per hectare to the total Potentially Eligible Area in each country we can derive the potential allocation to area-based payments after 2027 (this calculation and the results are described in detail in my previous post).
By assuming that the distribution of payments will remain the same as for area-based payments in 2022, the last year of the previous CAP, and by assuming that all holdings in a size class receive the average payment in that size class, we can derive the potential impact of applying degressivity and capping to the area-based payment amounts after 2027.
The results show that the impacts will be very different across countries, depending on their average payment per beneficiary and the degree of concentration of their payments. The higher the average payment, and the more concentrated these payments are, the greater the impact of degressivity and capping. Czechia is the outstanding example among the countries I have selected here, where potentially the funds it can use for area-based payments will be reduced by around one half if it applies the maximum payment per hectare, so these funds would become available to use to finance other CAP instruments. In Denmark, which is close to Czechia but still with both lower average payment and a less concentrated payment distribution, the impact of degressivity and capping drops to around one-quarter of the area-based payment amount at the maximum payment per hectare.
These countries show the greatest impacts. Impacts for other countries are much smaller. For France and Ireland, the savings vary between 1 and 12% but these are two countries with among the least concentrated payments distribution. I have not attempted to calculate an EU average, but my estimate is that it might lie between 10 and 20%. This will depend both on the overall payment rate per hectare that countries choose to establish for their area-based payment, but also on the extent of differentiation between farm groups and geographical areas that they establish.
These figures are probably smaller than many readers had imagined. The degressivity and capping rates are much more aggressive than what has previously been proposed, and yet their impact in reducing the potential area-based payments is relatively limited. The inference I draw is that relying on degressivity and capping to release sufficient funds to finance other CAP instruments including agri-environment-climate actions may well be a false hope.
Technical note
The two key assumptions behind the calculations in this post are (a) that the distribution of area-based payments after 2027 will reflect the distribution of decoupled payments in 2022, and (b) that we assume that all holdings within a payment size class receive the same average payment of that class. The former assumption can be criticised because the distribution of payments in 2022 was influenced by factors that are no longer relevant (for example, the continued existence of historic payments in some Member States and different ways of implementing the greening payment). Also, there have been further changes to the delivery of area-based payments in the current CAP including the introduction of the mandatory CRISS payment, which will also have affected the distribution. But unfortunately data on the distribution of payments for the claim year 2023 will not be available until June or July next year given the Commission’s apparent policy to delay publication. Ireland, for example, has capped BISS payments at €60,000 under the current CAP which would no longer be possible under the new proposal.
Still, it is the second assumption that is likely to have more impact on the results. There are two reasons to expect that this methodology may underestimate the likely savings from degressivity and capping. One situation arises where the average payment in a size class falls just below a degressivity threshold, let us say the threshold of €20,000 even though the payment class has the range, say, €15,000 to €40,000. This implies there would be no savings attributed to degressivity in that class, even though some holdings will receive payments about the €20,000 threshold.
The second situation is where the distribution of payments within a size class has an upward skew, meaning that most beneficiaries are located towards the lower end of the payment class range, but there are a few beneficiaries with payments closer to the higher end of the payment class range. In this case, the average (mean) payment per beneficiary is above the median payment. In this situation, applying the marginal rate deduction for each beneficiary for amounts above the threshold will yield greater savings than applying this rate to the average payment and then multiplying by the number of beneficiaries in the class.
For these reasons, my estimates of savings from degressivity and capping are likely to be conservative and to show lower figures than if we had access to the individual raw data.
I provide here the workbook and data I have used to make these calculations which readers can use to also derive results for other countries not considered in this post.
This post was written by Alan Matthews
Update 31 July 2025. I added Table 1 to correct the way in which I had previously interpreted the degressivity and capping formula and the figures in the post have been adjusted to reflect this formula. A big thanks to Henrik Maass for helping me to understand how the degressivity and capping formula is implemented in Table 1.
Photo credit: Alan Matthews, Storm clouds on the horizon.

Many thanks for this article.
When talking about Spain, are we talking about 6 to 14% of the total of direct payments or just of BISS?
In the current system in Spain in 2023, 2.4 billions are paid in BISS, and degressivity and capping make it possible to recuperate 8,6 millions, which is just 0,3% of total BISS.
That would be a big change if your calculation were to be confirmed.
Very helpful comment, Maxime. In my post I wanted to calculate the likely savings in area-based payments that might result from the proposed degressivity and capping rules after 2027. You propose a different benchmark by asking how these savings compare to the savings obtained by implementing the current degressivity and capping rules in the current CAP. It seems in Spain the proposed degressivity and capping rules could result in a very substantial increase in the percentage share of the area-based payment that would be affected. This does not surprise me, as the proposed rules are more steeply degressive than what we have at the moment, and that is a useful perspective to keep in mind. Just for clarification, in the proposed new Regulation, there will be just one area-based income support payment which can be differentiated by groups of farmers (e.g. young farmer, small farmer, etc) or geographical area. Whether we refer to this single payment as BISS or not is a moot point, but for a like-with-like comparison you should also include the CRISS and CIS-YF in your calculation, not only BISS (which of course would only strengthen the point you make). Great observation, thanks a lot.
Thank you for this post.
I think the capping amount above €100,000 should refer to the amount remaining after applying previous reductions from degressivity, and not, as your spreadsheet suggests, the potential payment amount before any reductions are applied.
Best regards
Wow, Tomasz, this is a really interesting interpretation. I wrote above in the post that I found the legal text setting out the degressivity and capping rules not at all clear, so it does not rule out your interpretation. It would make the calculation of degressivity and capping for the individual farm quite complicated! But this is something let us hope the Commission can clarify quickly. For the moment, as I explained the basis for my calculation, I am inclined to leave the figures as they are. Given the confusion around the publication of the proposals and the lack of a relevant impact assessment, I think it will be very important for the Commission to publish a series of detailed briefs and guides to its proposals immediately after the summer break. Thanks for highlighting this alternative interpretation of how degressivity and capping might be implemented!
You are absolutely right that the draft proposal is …. a bit imperfect 😉
I think both interpretations are just guesses at what the Commission might have meant.
Many thanks for the article and insightful comments. I also agree with Tomasz’ way of interpreting the degressivity proposal (thanks for updating the article today, Alan!), as it actually reflects the way that Spain applies the maximum BISS support now: first you apply degressivity (which is actually 100% beyond 100,000€ in Spain) but then there is a maximum BISS support of 200,000€ (capping).
You could wonder: how can you reach 200k with such strict degressivity? Because labour costs are not subject to degressivity, and they can be well beyond 100k in many farms. According to an example provided by the Spanish paying agency, a beneficiary with 290k in BISS (before capping) and 140k in labour costs, would only apply degressivity to the 150k (290-140). This would reduce the amount from 150k to roughly 80k, but then you add the “untouched” 140, and you have 220k – and this is when the 200k capping limit kicks in.
In a way, this example connects several of the responses to the blog post: it explains why such a small amount of BISS is recovered through capping/degressivity in Spain nowadays (Maxime), and it brings in the issue of whether labour costs should be factored in (Alfons), which I see as a likely topic to enter the MFF-CAP negotiations in relation to all this.
Greetings!
Note to all: to avoid misunderstanding this comment refers to the earlier version of the post which has now been corrected to reflect the point that Tomasz has made.
Thank you Alan,
I agree with Tomasz and calculated the implications of the EU CAP Proposal for Germany
Let us assume, for simplicity, that Germany introduces a decoupled income support of €200 per hectare (currently, Germany allocates some €211 per ha for income and redistributive payments) and applies it using the proposed degressive and capping scheme. Under this scheme, farms would receive:
• €200/ha for the first 100 hectares,
• €150/ha for the next 200 hectares,
• €100/ha for the following 250 hectares, and
• €50/ha for the next 500 hectares,
until the capping limit of €100,000 is reached at 1,050 hectares.
National Impact
Based on results of the 2023 FSS, for Germany as a whole, this would result in an average premium of some €163 per hectare, as approximately 25% of the agricultural area is managed by farms larger than 500 hectares. On average, this would translate into income support of €5,900 per full-time working unit.
Regional Impact
• Bavaria: The average premium would be some €194/ha, as very little land is farmed by holdings over 500 hectares. This would correspond to €5,200 per full-time working unit.
• Brandenburg: The average premium would be only some €114/ha, since more than 75% of the land is farmed by holdings over 500 hectares, and around 40% by farms over 1,000 hectares. These large farms would receive an average of €64/ha and account for just 20% of Brandenburg’s total decoupled payments. Given that one-third of the workforce is employed in farms over 1,000 hectares, these farms would receive around €4,900 per full-time working unit, while smaller farms in Brandenburg would receive nearly €11,000 per unit.
Key Implications
• Within Brandenburg, the degressive payment scheme would cause significant distortions between farms. A particular issue arises from the fact that farms larger than 1,000 hectares still operate with a higher labour intensity than those between 100 and 1,000 hectares. This could further accelerate the already observable trend of abandoning labor intensive but less profitable activities such as dairy farming. Similar effects are likely in other eastern German federal states.
• At the national level, Germany would experience a strong regional redistribution of funds—particularly from the economically weaker eastern states to the relatively wealthier southern states.
Key Problems with the EU CAP Proposal
1. Narrow Definition of “Farmer” Ignores Agricultural Employees
A major flaw in the proposal is that the EU Commission continues to define “farmers” almost exclusively as farm owners, completely overlooking the growing importance of employees in the agricultural sector. This approach fundamentally contradicts the stated goal of creating future opportunities for the younger generation.
Rather than encouraging young people to take over unproductive and unprofitable farms, a more forward-looking strategy would be to support farms in offering attractive, stable, and innovative jobs in agriculture. This would better reflect the evolving structure of the sector and help retain skilled workers in rural areas.
2. Lack of Focus on Productivity and Innovation
The second key issue is the Commission’s neglect of productivity and efficiency. This stands in direct contradiction to the recommendations of the Draghi Report, which emphasizes the need to boost productivity and foster innovation across the EU economy.
By focusing primarily on supporting farmers “in need,” the policy risks creating a cycle of dependency—essentially “breeding” farmers in need rather than empowering them to become competitive and resilient. A more effective approach would reward performance, innovation, and sustainable growth, aligning agricultural policy with broader economic goals.
Some very interesting points, Alfons, not least the way in which you interpret and calculate the degressivity formula in the proposed Regulation which indeed corresponds to Tomasz’ approach and differs from my marginal degressivity interpretation and even more from the ‘slab’ interpretation of Farm Europe (see my LinkedIn comment here https://www.linkedin.com/feed/update/urn:li:activity:7354628560097017856/). I can see how all interpretations can be read into the draft text and we really need the Commission to clarify what they mean.
You worry that the application of the formula would lead to a redistribution of CAP funds from the economically weaker eastern states to the relatively wealthier southern states. I hesitate to make specific remarks about Germany, but at least in principle the possibility to differentiate payments by groups of farmers and by geographical area would seem to provide some tools to prevent this if the political desire was there.
You make two other points. One is that the narrow definition of a farmer ignores agricultural employees and you illustrate this by calculating the implied rates of support per FWU on a farm. I must say I do not find this argument convincing. The suggestion is that we should maintain support for larger farms because they are more labour-intensive and that this will give more and better-paying jobs for the younger generation. But I see little relationship between an unconditional payment made direct to a holding and the wages of employees which will be determined in the local labour market.
I have more sympathy with your second point, that focusing payments on smaller farms does little to help them become viable and gives no incentive to help them to become competitive. This requires structural adjustment, meaning the exit of many smaller farms to allow others to grow to a viable size. This is also desirable for our wider economy where demographic developments mean we often cannot fill more productive and useful jobs. But I recognise that mostly these more productive jobs are being created in urban areas, so this necessary process of structural change implies the desertification of many rural areas. It is this tension that politicians are responding to when the targeting of support on smaller farms is discussed.
Thank you Alan. Regarding your concern on subsidizing larger farms because of higher employment: in this regard, I see two points which are closely related to (1) the fact that direct payments are justified as income support and (2) article 39 of the Treaty of Rome arguing to increase „the income of people engaged in agriculture“. Just an example: recently I visited an agricultural cooperative near Halle with some 5000 ha with some 100 employees and 170+ members which are current and former employees. Currently, they receive some 1 million €. Would it be fair with regard to my points (1) an (2) to cut payments to €100,000€ if a neighbor farming 300 ha with just 1 person receives some €50.000?
Thanks Alan for this post.
I share Tomasz interpretation of degressivity calculation.
There is another point that I understand differently: the Commission writes about support given “to a farmer”, not “to a farm”. So my interpretation is that each threshold should be multiplied by the number of active farmers within the farm. Do you think it is plausible? I might be wrong, but in France multiplying CAP thresholds by the number of farmers is already frequently done for GAEC (Groupement agricole d’exploitation en commun).
Based on these two assumptions and using 2023 FADN data, I find for France an impact from 1,8% to 7% (for 130€/ha and 240€/ha respectively), and 4,8% if keeping the actual 2023 decoupled payments amounts per farm (hastily done simulation, these figures may be wrong).
Thanks for this comment, Axel. Just to avoid misunderstanding, Tomasz’ comment referred to the first version of the post, and in the revised version I also have adopted his approach as I understand it. You correctly note that farmers who participate in a GAEC in France are treated as individual farmers for the purpose of payments under the ‘transparence GAEC’ principle. I would assume that principle would also apply to any degressivity or capping. For this reason, I would be cautious in using FADN data to draw inferences about the impact of degressivity and capping because, in contrast to payments, here the data refer to holdings at the GAEC level and not the individual farmer-members. I am not sure how you backed out the number of GAEC members in a GAEC from the FADN data, but the proposed definition of a farmer (see COM(2025) 565 Article 4(3)c) is
“(c) in the context of the CAP, a farmer who is:
(i) a natural or legal person whose holding is situated in the Union and whose principal activity is agricultural activity in accordance with the criteria defined by the Member States in line with this Regulation; or
(ii) natural person or small legal person, whose principal activity is not
agriculture, but who is engaged in at least a minimum level of agricultural
activity, as defined by Member States.
Is it possible that applying this definition could influence the results you obtain?
Thanks Alan for your reply.
I hadn’t noticed the definition of farmer you cited, so my assumption was wrong (and my results too). As you note, multiplying the thresholds will probably apply only for France’s GAEC, so the scope is much more limited than what I thought.
I am familiar with FADN for France only, but it is a quite extensive database. The legal form of each beneficiary is included, which makes it easy to differentiate GAEC when computing the impacts. In practice:
[1] I start from the utilised agricultural area (UAA) of each farm in the sample, and multiply it by the average area-based income support per hectare (130 and 240€/ha), which gives the payment for each farm without degressivity nor capping.
[2] Then I calculate the payment if degressivity and capping would apply, multiplying the thresholds by the number of individual farmer-members only when GAEC is the legal form.
[3] I call “impact of degressivity and capping” the whole sample average difference between these two amounts.
My feeling is that using FADN can bring a more precise insight than using FSS, because it allows to run simulation using a large number of parameters. So it enables to evaluate the impact for a type of system, or a production size, or economic dimensions, etc. For example it is pretty straightforward to estimate the impact of degressivity and capping in France for beef systems with less than 100 livestock units in Limousin Region…
But I am no expert, so I would be interested to know your opinion about working with FADN and the limits of this approach.
Hi Axel, I am not familiar with the structure of the French version of the FADN database. You are right that it can provide a richer data analysis than the DG AGRI data on the distribution of payments alone. You start with farms ranked by UAA size, your results will partly be influenced by how many size categories you have as you assume that all farms in the same size class will receive the average payment in that class. With a small number of size classes, this assumption can give rise to biased estimates. The other issue that would interest me is how individual farmers are identified in a GAEC. You mention you know the legal form and the number of farmer members. Is it the case that each farmer member has an equal share of the land farmed by the GAEC, or can the shares be different? That could also influence your results.