All the focus last week was on the publication of the Commission Communication on the Future of Food and Farming. This document has been greeted with both curiosity (concerning the potential of the proposed new mode of delivery and governance to deliver both simplification of the CAP as well as improved targeting and results on the ground) and criticism (from farm groups worried that it eliminates the ‘common’ in the Common Agricultural Policy and environmental groups worried that it could facilitate the continued transfer of a large chunk of the EU budget to farmers with no questions asked). It will take some time to tease out its full implications, and this is something I will return to on this blog in the future.
Last month DG AGRI also published without fanfare on its website a very useful summary report on the implementation of the 2013 CAP reform in the 2015 claim year, the first year of implementation of the new CAP. Understanding how the current policy is implemented should be the basis for proposals for its improvement. In this post, I highlight some points of interest from this recent implementation report.
The area receiving payments
With the introduction of the Basic Payment Scheme (BPS) in 2015 in the 18 Member States which use this scheme there was a re-allocation of payment entitlements. Payment entitlements were allocated to active farmers provided they were farmers in 2013, but Member States had the possibility to extend the list of eligible farmers to those who were not entitled to direct payments in 2013 but produced certain crops or cultivated vineyards in that year, those who were allocated entitlements from the national reserve in 2014, and those who never held owned or leased-in entitlements but provided evidence that they were producing in 2013.
This allowed particularly those Member States that opted for the Single Payment System (SPS) historic model to include more farmers and more land in the BPS system. The area covered by BPS entitlements in 2015 was 6.7% greater than the area covered by SPS entitlements in 2014. Those Member States that applied the SPS regional or hybrid models or the 10 Member States that apply the Single Area Payment Scheme (SAPS) were already more inclusive before 2015.
As a result, the gap between the EU’s Utilised Agricultural Area (UAA) and Potentially Eligible Area (PEA) has narrowed. The former corresponds to the total area irrespective of any claim for direct payments. The latter corresponds to the total area declared by beneficiaries and potentially eligible for payment.
The report introduces a new concept (for me) called the Determined Area which is different to the PEA. The differences are explained by limitations on the number of payment entitlements in some of the 18 BPS Member States as well as the results of administrative and on-the-spot checks. Overall, the Determined Area was 2% below the PEA in 2015 compared to 9% below in 2014. Examples of limitations given in the document include:
• BE-Flanders, IE, ES and PT limited the allocation to the lowest number between the eligible hectares declared by the farmer in 2013 and those he/she declared in 2015 (area declarations of the two years compared irrespective of the number of entitlements held by the farmer).
• AT and UK-Scotland applied a reduction coefficient to eligible hectares consisting of permanent grassland located in areas with difficult climate conditions.
• FR did not allocate entitlements for eligible hectares which were vineyards in 2013; NL and EL did not allocate entitlements for arable land under permanent greenhouses.
Overall, the Determined Area was 13% smaller than the EU UAA in 2015 (that is, around one-eighth of the EU agricultural area did not have entitlements to direct payments), which was a reduction on the 16% gap in 2014. The gap is due to farmers being below the minimum requirements for being granted direct payments, farmers not fulfilling the eligibility conditions for being allocated payment entitlements, or farmers not applying for direct payments possibly because they feel the conditions attached are too stringent relative to the payment they would receive.
There remains considerable variation between Member States, and in some Member States (e.g. Bulgaria, Croatia and Romania) up to 30% of the UAA area is not part of the Determined Area which is the area of land on which payments are actually made. A table in the report gives the figures for UAA, PEA and Determined Area in each Member State/region in 2015.
The number of farmers receiving payments
The DG AGRI report does not give directly the change in the number of beneficiaries of direct payments between 2014 and 2015. Instead, it presents data on the change in the number of applicants. It seems that in 2014 some farmers submitted the single application for reasons other than applying for direct payments (e.g. for manure deposit management in BE-Flanders). Thus, despite the increase in the area eligible to receive direct payments, the number of applicants actually fell by 5% between 2014 and 2015. This is partly put down to changes in reporting procedures, as in 2015 only those admissible to the BPS, SAPS or Small Farmers Scheme are included.
Nonetheless, the fall in the number of applicants in some Member States/regions is striking. Bulgaria had 35% fewer applicants in 2015 compared to 2014 despite continuing to administer the SAPS scheme. Bulgaria’s explanation in the report is that changes in national legislation regarding compulsory social and health insurance is the main reason for the significant decrease in the number of applicants. The fact that a change in a country’s social welfare code can have such a dramatic effect on the number of CAP beneficiaries from one year to the next raises puzzling questions regarding the eligibility of landowners for payments in that country. But there were also striking reductions in other countries/regions: -20% in UK-Northern Ireland, -15% in UK-England, -13% in Malta and -10% in Italy. The situation in countries with a significant increase in the number of applications (+18% in Portugal) is more clearly correlated with the allocation of entitlements in 2015 to newly-eligible farmers.
The size of payments received
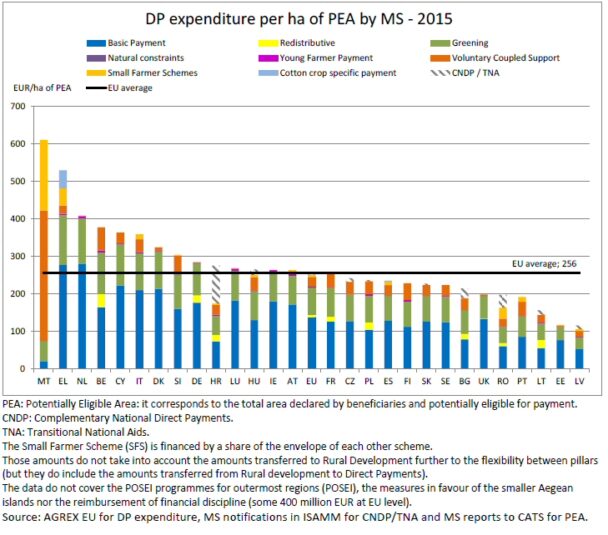
In 2015, the average direct payment granted per hectare of area declared by farmers amounted to €256/ha in the EU, including the crop specific payment for cotton and the possible national “top-ups” (Complementary National Direct Payments for Croatia and Transitional National Aids for SAPS Member States (except for EE and CY)). This average DP/ha goes from €115/ha in Latvia to €610/ha in Malta (see figure).
These amounts are after possible transfers of a share of the DP envelope to or from Rural Development if decided by the Member State with the flexibility between pillars (for example, Latvia transferred significant amounts to its Rural Development envelope which contributes to its low average payment per hectare).

The figure also shows the average composition of the direct payments received by farmers in each Member State. The shares reflect the financial allocation (either fixed at EU level or, in most cases, decided by Member State) and actual payments. The basic payment (Basic Payment Scheme or Single Area Payment Scheme) represents on average 54% of the direct payments. However, there is obvious heterogeneity in the way in which payments are made to farmers in the different Member States.
The impact of degressivity and capping
A small step was made in the 2013 reform towards limiting the size of payments to the very largest farms. A mandatory reduction of 5% to all basic payment amounts (not the total direct payment received by a farm) was applied to amounts greater than €150,000, with the possibility to deduct salaries from the amount of basic payment before applying the reduction. Member States had, in addition, the option to apply higher reductions as well as capping (= 100% reduction). Those Member States that applied the redistributive payment with more than 5% of their national ceiling allocated to the scheme could decide not to apply the degressivity mechanism (BE-Wallonia, Croatia, Germany, France, Lithuania and Romania).
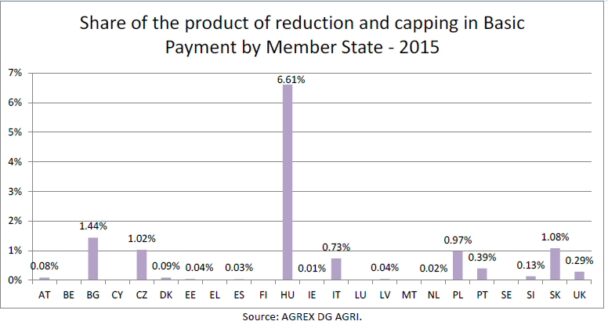
Degressivity and capping, as I showed in my study of direct payments for the European Parliament in 2016, has been totally without effect. In 2015, the amount of payments stopped by degressivity and capping amounted to €98 million, which represents 0.44% of the basic payment expenditures (around 0.25% of total direct payments). Only in Hungary has degressivity and capping had a noticeable effect, where it yielded nearly 7% of the national envelope (see next figure). Degressivity and capping is one of the central reforms proposed in the CAP Communication last week, but on the evidence to date, there is little indication that it will have an impact.

The redistributive payment
The redistributive payment is an alternative way to focus income support on smaller farmers by granting an extra payment per hectare for the first hectares below a certain limit. In 2015, the redistributive payment (RP) was implemented by 9 Member States: BE-Wallonia, Bulgaria, Croatia, France, Germany, Lithuania, Poland, Romania and UK-Wales. All farmers in these Member States eligible for BPS/SAPS may receive the redistributive payment. However, they only receive this payment up to a certain number of hectares per holding. As a result, only a part of the BPS/SAPS area benefits from this payment, which creates a redistributive effect.
The financial allocation to the scheme goes from 0.5% (the UK-Wales) to 15% (Lithuania) of the Member States national ceiling for direct payments. In most of the Member States applying the scheme, the payment was made on around 50% of the eligible BPS/SAPS area.
Most of these Member States gave either a flat-rate payment (for example, France made a payment of €25/ha on the first 52 hectares) or tiered degressive payment (for example, Germany made a payment of €49.64 on the first 30 hectares and a payment of €29.78 on the next 16 hectares) on the first hectares. However, in Poland, holdings with less than 3 hectares were ineligible for the redistributive top-up which was confined to those with between 3 and 30 hectares of eligible area (who received €40.10/ha). In Romania those with less than 5 hectares received a top-up of just €5/ha while those with eligible area between 5 and 30 hectares received payments of €51.08. These different patterns of implementation will have different implications for the structural evolution of farms.
What impact on the distribution of payments?
In addition to these changes in the structure of direct payments introduced in the 2013 CAP reform, that reform also shifted payments between Member States (‘external convergence’) and within Member States (‘internal convergence’). Given the emphasis on addressing the inequality of payments in the latest Communication, we would like to know what the impact of these changes, as well as the changes in the eligibility for payments and the introduction of the redistributive payment which are described here, have been on the shape of the Lorenz curve of payments (measuring the degree of inequality of payments).
This exercise must await the publication of DG AGRI’s annual report on the distribution of direct payments. This is normally published either in December or January. Until then, while we can only speculate on what the impacts might be, this implementation report suggests that any impacts on the distribution of payments between beneficiaries will be limited.
This post was written by Alan Matthews.
Update 3 December 2017: This post has been revised to remove the implication that those who no longer qualify for payments in Bulgaria may not be farmers for that reason. The reason for the loss of one-third of applicants in one year in that country needs further investigation.
Photo credit: Agri.EU – social network of EU farmers

Europe's common agricultural policy is broken – let's fix it!

